W3 R77–R78: covariance robustness figure and evidence ledger
Source and plot evidence ledger · 20 October 2026 · unreleased W3 research
Research-only results
Figures concern synthetic Gaussian functional slope trajectories. W3 #289 and gaze-loss #296 remain open. Green simulation CI and independent raw-array reconstruction do not demonstrate general nominal-90% simultaneous inference. The published stable package API does not implement a qualified version of these candidate methods.
Figure 1 — R78: whole-function truth inclusion
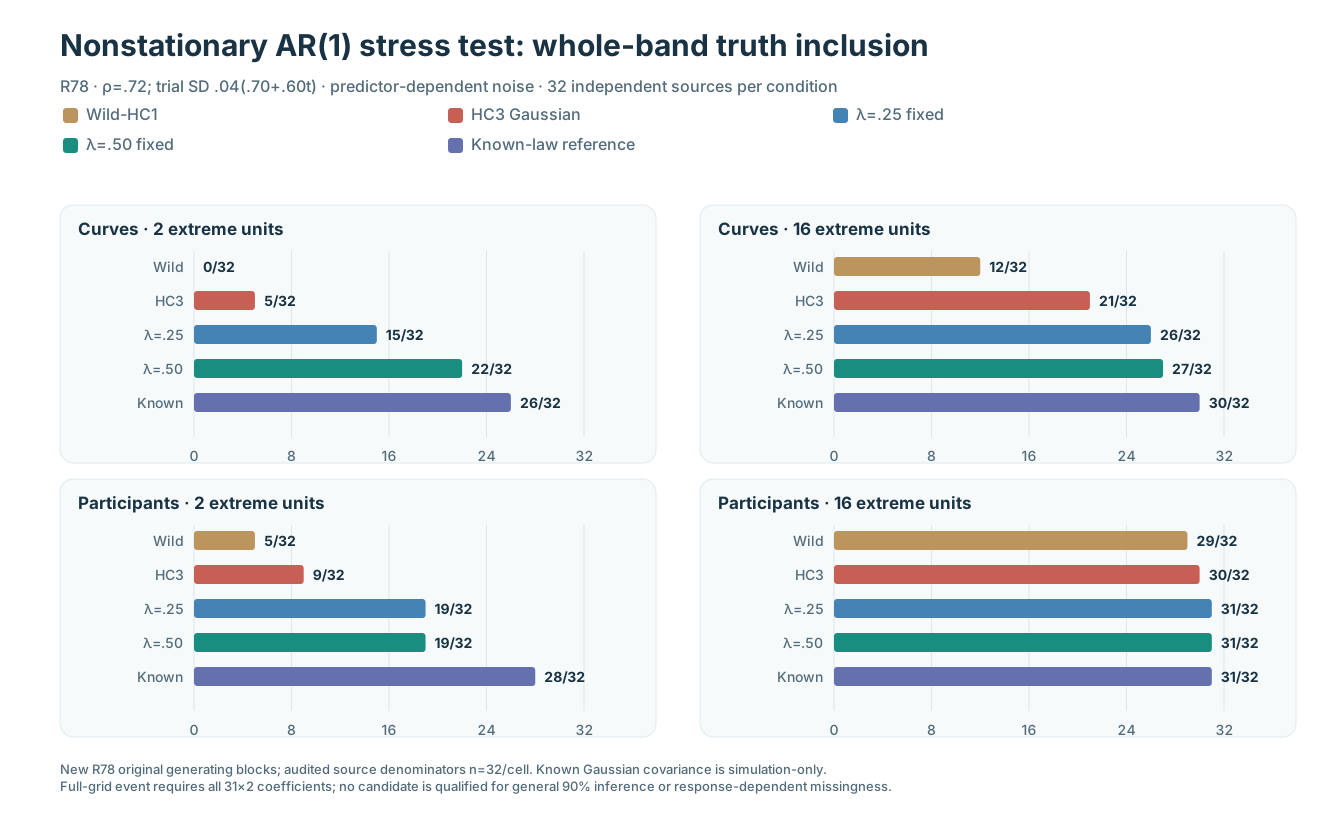
Read the complete R78 scientific article. Every plotted count is a 31 × 2 full-function truth-inclusion result among 32 newly generated independent primitive source blocks, not 62 pointwise events, not 999 reference draws, and not human eye-tracking observations.
| Gaussian error regime: predictor-dependent, AR(1) rho=.72 | Curve, 2 anchors | Curve, 16 anchors | Participant, 2 anchors | Participant, 16 anchors |
|---|---|---|---|---|
| W3 wild-HC1 | 0/32 | 12/32 | 5/32 | 29/32 |
| Estimated HC3 Gaussian | 5/32 | 21/32 | 9/32 | 30/32 |
| Fixed λ=.25 | 15/32 | 26/32 | 19/32 | 31/32 |
| Fixed λ=.50 | 22/32 | 27/32 | 19/32 | 31/32 |
| True source-law Gaussian benchmark | 26/32 | 30/32 | 28/32 | 31/32 |
Prespecified constant-variance falsification under two anchors, in original independently audited sources: curves HC3 / λ=.25 / λ=.50 / true Gaussian = 19/32, 23/32, 27/32, 28/32; repeated-trial participants 18/32, 25/32, 28/32, 28/32. The corresponding 16-anchor results remain in the immutable source aggregate.
Figure 2 — R77 to R78: unpaired covariance sensitivity
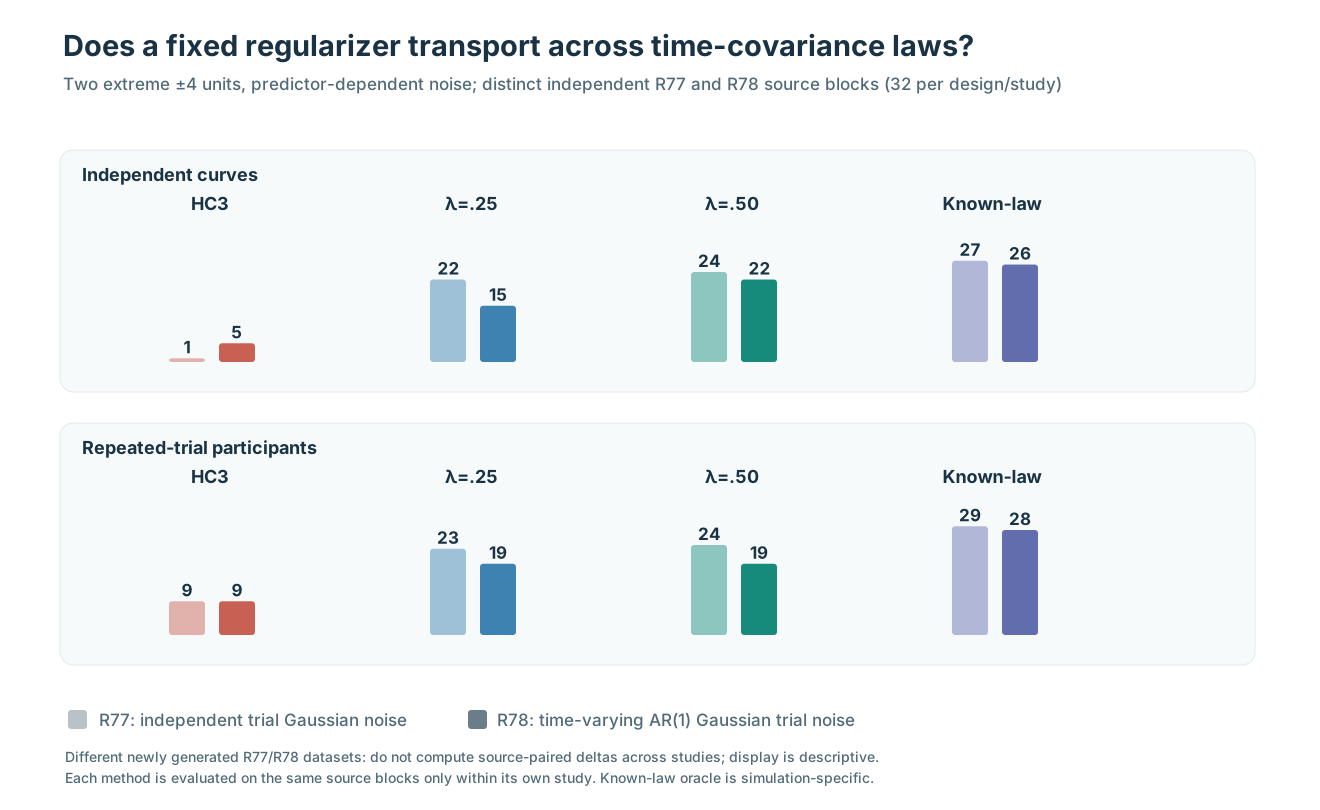
This figure deliberately uses different alpha in the two within-method bars to distinguish the new R77 and R78 simulations. They share a frozen method specification but not the same source-generating data. Each original experiment has 32 independently generated primitive source blocks in the shown condition. Therefore method comparisons within one study are source-matched, but cross-study condition differences are not source-paired effects.
Under two extreme predictors with predictor-dependent unit variance, source-level full-function inclusions in R77 → R78 were: curves HC3 1→5, λ=.25 22→15, λ=.50 24→22, exact Gaussian law 27→26; participants HC3 9→9, λ=.25 23→19, λ=.50 24→19, exact source law 29→28. Both experiments remain fully observed and Gaussian; R78 adds trial Gaussian temporal AR(1) dependence and time-varying trial SD.
Figure 3 — R78 lower-tail standard error and Gaussian critical
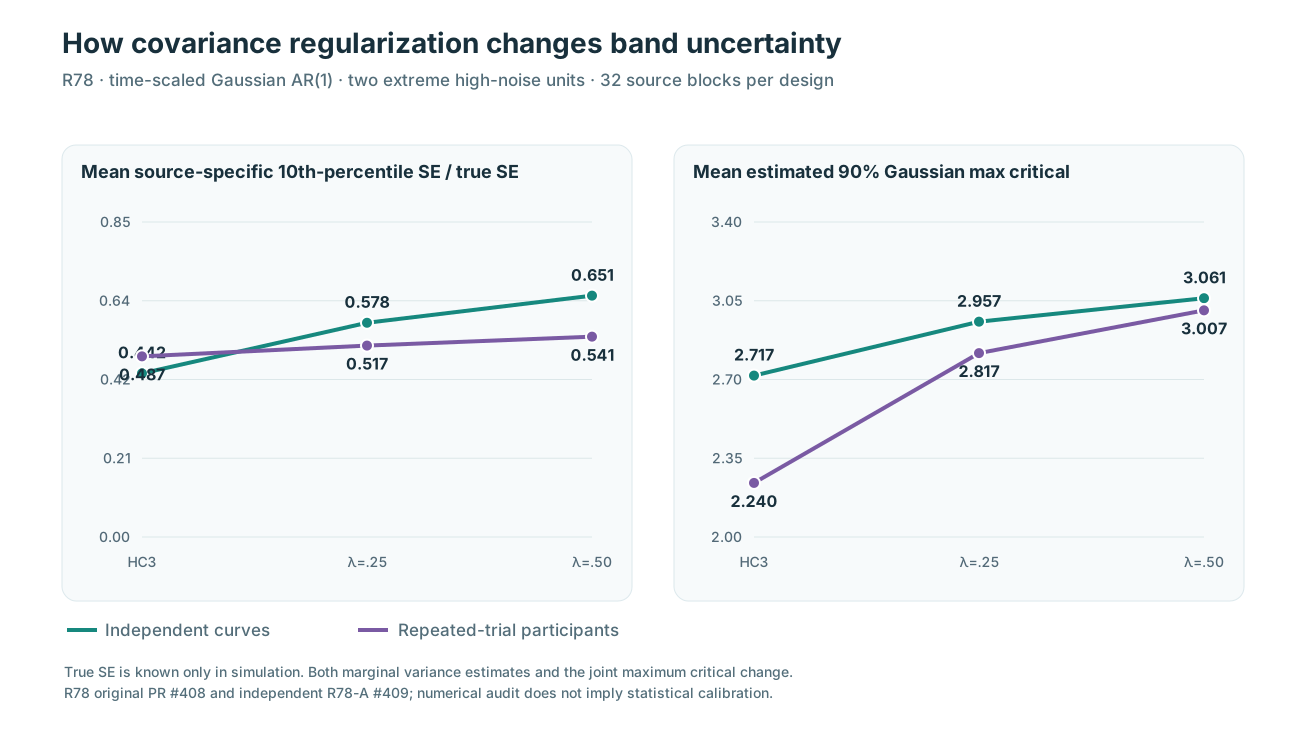
For R78 two-anchor predictor-dependent heteroskedasticity, the mean across 32 sources of each source-specific 10th-percentile over 62 grid cells of estimated/true SE equals curves 0.441586, 0.578093, 0.651293 and participants 0.487474, 0.516516, 0.540620 for HC3 / λ=.25 / λ=.50. The corresponding estimated 90th-percentile Gaussian max criticals average curves 2.717383, 2.957030, 3.061352 and participants 2.240335, 2.817284, 3.007372. The true SE ratio denominator is known only under the synthetic generating law and is not an available real-data diagnostic.
Original R78 / independent R78-A source provenance
| Retained evidence | Source and verification |
|---|---|
| Prespecified R78 original experiment | Draft research PR #408; study design fixed before new source outcomes |
| Original R78 workflow | Workflow #39477000929: 12/12 scientific jobs passed |
| Original SHA256 archive | Artifact #12290295000; scientific checkout f438b9680d81f5e5e3e893b1ff7a0bc93383a619 |
| Independent source reconstruction | R78-A draft PR #409, separately implemented |
| Independent original archive audit | Workflow #39477446946: 4/4 audit jobs passed |
| Independently verified numerical report | Artifact #12290570185 |
| Actual accepted/attempted source cases | 256/256, 0 refused; 32 independent primitive blocks per design/support/variance cell |
| Original raw maximum-statistic draws | 256 source cases × 5 reference distributions × 999 draws = 1,278,720 original numerical values, all independently reconstructed |
| Gaussian generating law | New 31-time-point rho .72 AR(1) correlation, trial SD .04(.70+.60t), participant latent effect retained; two independent gaze-coordinate innovation channels |
| Comparison methods | Unchanged W3 wild-HC1, estimated HC3 Gaussian, unchanged fixed covariance λ=.25 and λ=.50, generating-law known Gaussian simulation benchmark |
| Independent-source qualification | Numerically audited, but not 90%-calibrated or robust under MNAR/irregular real gaze observations |
| Public package consequence | None. W3 #289 and #296 open; no stable code merge or eyetrajectoriespy 1.2/PyPI release |
R77 earlier original source workflow #39403101425 and independent audit #39403655264 each verified their own separate 256 source-condition cases and 1,278,720 maximum-statistic numbers. Reproduction of two different studies must not be used to double the independent source count for a single condition.
Reading order
Why numerical correctness may still under-cover → R77 fixed covariance regularization → R78 nonstationary AR(1) stress test → How to interpret independent-source and whole-band audits.
The three SVG files are original vector renderings of independently audited numerical source summaries. They are not additional model fits, figures of recorded human eyes, or independently sampled data. All inference claims remain restricted to the stated generating designs.