When numerical correctness does not give calibrated functional confidence bands
Scientific research article · 20 October 2026 · W3, R70–R75 · unreleased 1.2 research
Do not interpret the plotted bands as qualified inference
The published stable package is eyetrajectoriespy 1.1.0. The W3 research discussed here lives in separate draft 1.2 branches and does not establish a reliable 90% simultaneous-confidence procedure for field eye-tracking data. A CI-green numerical implementation is not evidence of nominal coverage. Scientific blocker #289 and response-dependent gaze-loss blocker #296 remain open.
What is being tested?
A functional coefficient \(\beta_1(t,d)\) describes the association between a scalar predictor and a continuous response at time \(t\) and gaze coordinate \(d\). The W3 study asks whether a reported 90% simultaneous slope band contains the entire generating function on a fixed 31-time-point × 2-coordinate grid, rather than merely containing individual coefficients at some grid points.
Let \(\hat\beta_1(t,d)\) be a fitted slope, \(\widehat{\mathrm{SE}}_1(t,d)\) its standard error and \(c_{.90}\) the estimated 90th percentile of a maximum-statistic reference. The simultaneous band has the schematic form
Truth inclusion is one binary event per independent generated dataset: all 62 grid cells must contain their known slope. As a result, correctly reproducing OLS coefficients, HC1/HC3 standard errors or bootstrap quantiles to numerical precision cannot, by itself, establish that this event occurs with 90% frequency.
Three independent falsifications, one recurring problem
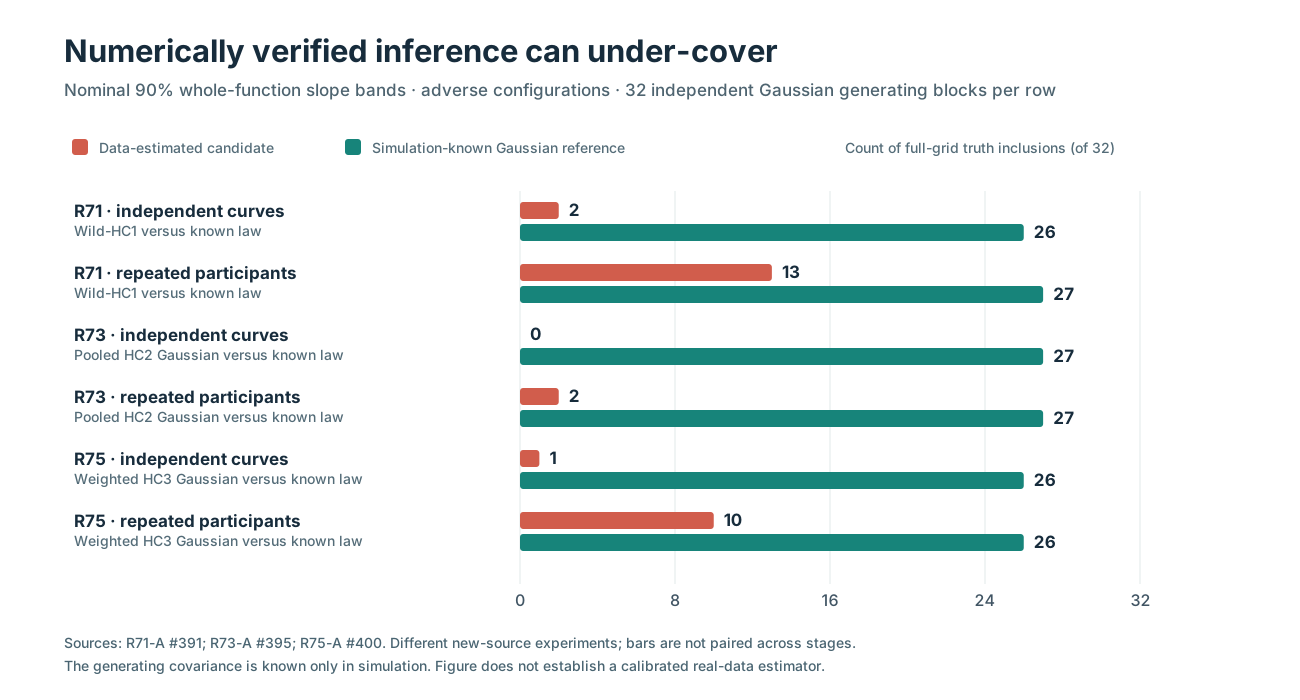
Figure 1. Audited whole-grid truth inclusion counts in three different fresh-source experiments. Each plotted design/condition uses 32 independently generated Gaussian source blocks. Red bars use the indicated data-estimated procedure; teal bars use the Gaussian law known from the synthetic generator, which is not available for actual recordings. Results are not paired across research stages.
| Research stage and adverse setting | Candidate, full-grid truth inclusions | Known-generating Gaussian benchmark | Source audit |
|---|---|---|---|
| R71: extreme predictor leverage, 72 independent curves; unchanged wild-HC1 | 2/32 | 26/32 | R71-A #391 |
| R71: extreme leverage, repeated-trial participants; unchanged wild-HC1 | 13/32 | 27/32 | R71-A #391 |
| R73: extreme leverage and predictor-dependent variance, curves; pooled HC2 Gaussian | 0/32 | 27/32 | R73-A #395 |
| R73: same adverse regime, participants; pooled HC2 Gaussian | 2/32 | 27/32 | R73-A #395 |
| R75: same adverse regime, 72 curves; slope-weighted HC3 SE and HC3 correlation | 1/32 | 26/32 | R75-A #400 |
| R75: same adverse regime, 36 participants × 3 trials; weighted HC3 | 10/32 | 26/32 | R75-A #400 |
The nominal level is 90% throughout, not the measured percentage. These small-cell frequencies have material binomial Monte Carlo uncertainty. There are 32 independent generating blocks per cell, not 999 independent bootstrap experiments and not 62 independent slope coordinates.
How the investigations narrowed the failure
R70 and R71: leverage, standard errors and critical values. In R70, switching from HC1 to HC3 generally improved observed inclusion without reaching the nominal target. R71 then used the synthetic law's actual covariance to produce a Gaussian maximum-statistic reference, under which inclusion improved markedly. Under extreme leverage, mean HC1/true slope-SE ratios were approximately 0.877 for curves and 0.786 for participants; the corresponding wild/known critical ratios were about 0.898 and 0.907. This implicated both marginal scale estimation and the maximum-statistic reference, rather than computational implementation alone. R70-A numerical audit · R71-A numerical audit.
R72 and R73: a favorable result falsified under unequal variance. R72's pooled HC2 residual-Gaussian reference looked promising in a fully observed common-covariance Gaussian mechanism: under extreme leverage, inclusion was 26/32 for curves and 29/32 for participants. R73 prospectively introduced predictor-dependent unequal variance. In that adverse regime, pooled HC2 Gaussian inclusion became 0/32 for curves and 2/32 for participants, while the known heterogeneous Gaussian reference included truth in 27/32 for each design. An improvement under a particular covariance law did not transport to another. R72-A · R73-A.
R74 and R75: a near-correct mean standard error is not enough. R74 introduced slope-specific unit weights into HC2/HC3 covariance construction rather than pooling the same residual covariance for every coefficient. In extreme heteroskedastic scenarios, mean slope-weighted HC3-to-true marginal SE ratios approached one, but whole-band inclusion could still be zero. R75 independently crossed true versus estimated marginal slope SE with true versus estimated joint Gaussian correlation reference in a frozen 2×2 factorial. For 72 independent curves under extreme leverage and unequal variance, inclusion was 26/32 with both generating components known, 20/32 with true SE and estimated correlation, 5/32 with estimated HC3 SE and true correlation, and 1/32 with both estimated. The four components are source-matched diagnostics, not four independently sampled studies or four validated inference methods. R74-A · R75-A.
Scientific reading of the evidence
The difficulty is not solved by selecting the most favorable result among these reference distributions. Marginal standard-error estimation, joint dependence, and the number of independently observed influential units interact. The generating Gaussian law provides a benchmark precisely because its covariance and truth are stipulated by the simulator; it cannot simply be substituted into a real-data package interface.
A critical next question is whether concentrated information from very few high-leverage observations produces unusually variable realized HC3 SEs even when their mean is approximately correct. R76 directly stress-tested that mechanism using new source blocks and additional independent extreme-predictor observations. Read the R76 results and original plots.
Evidence, reproducibility and boundaries
Every quantitative comparison above comes from separate original source simulations and their dedicated independent archive reconstructions. For the source-run identifiers, all plot values, artifact links, acceptance gates and retained negative results, see the W3 evidence and figure ledger.
All datasets are synthetic, fully observed and Gaussian; no authentic participant recording or MNAR dropout is involved in these comparisons. No study shown validates a generic 90% simultaneous-confidence inference API, establishes calibrated type-I error in other designs, or authorizes a 1.2 release. Research documentation is deliberately published separately from experimental estimator promotion.