Independent high-leverage support and functional confidence-band coverage
Scientific research article · 20 October 2026 · R76 original + independent R76-A audit
Simulation diagnosis, not a release-approved method
The original R76 study and its independent R76-A numerical audit are complete, but the candidate simultaneous bands are not generally calibrated. Both implementations remain in separate draft research PRs, not stable 1.1.0 or a published 1.2 release. Scientific blockers #289 and #296 remain open.
Why influential observations matter for a functional slope
The preceding W3 undercoverage analysis showed a striking combination: slope-weighted HC3 standard errors could be close to the true marginal SE on average yet the corresponding estimated simultaneous bands could under-cover severely. With only two extreme predictor observations and predictor-dependent noise, a small number of units may account for nearly all of the slope-estimation variance.
For an intercept-plus-slope regression, let \(a_i\) denote independent unit \(i\)'s exact design weight for the estimated slope and \(s_i\) its synthetic noise multiplier. The generating-law share of slope variance attributed to unit \(i\) is
This concentration index counts effective slope-variance contributors, not an effective sample size for every kind of inference. It is available in R76 only because the Gaussian data generator explicitly specifies the \(s_i\). A small value means the true slope variance is dominated by very few independent units. The R76 experiment examines what happens when more independent observations are placed at the influential predictor extremes.
Frozen source experiment
The source design was specified before any R76 outcomes were evaluated in research PR #402. It contains 32 new primitive Gaussian generating blocks in each of two independently generated designs: 72 independent curves; and 36 independent participants, each observed in three complete trials.
Within each source block, the experiment varies the number of independent predictor extremes x = −4 or +4: 2, 4, 8 and 16, split evenly between the two signs. Other predictor values are drawn from Uniform(−0.95, 0.95). The designs include constant Gaussian noise and unequal Gaussian noise scaled by \(s_i=1+0.75|x_i|\). The underlying Gaussian innovations are paired across the anchor-count and variance conditions. The experiment therefore generates 512 source cases (=32 blocks ×2 designs ×4 anchor counts ×2 variance regimes), not 512 independent replicates of any single cell.
The original W3 wild-HC1, slope-weighted HC3 residual covariance, Gaussian reference construction and fixed 31×2 truth grid were held constant. Each source produced 999 W3 wild maxima, 999 simulation-known Gaussian correlation maxima and 999 HC3-estimated Gaussian correlation maxima, with the empirical higher 90th-percentile rule. Original science run #39397281090 completed 12/12 scientific jobs and 512/512 datasets with zero refused sources. The read-only independently implemented R76-A audit run #39397981410 passed 4/4 jobs, separately reproducing all 512 original X/Y arrays, every source-level diagnostic and 1,534,464 original maximum-statistic values.
Whole-band coverage at different extreme-anchor counts
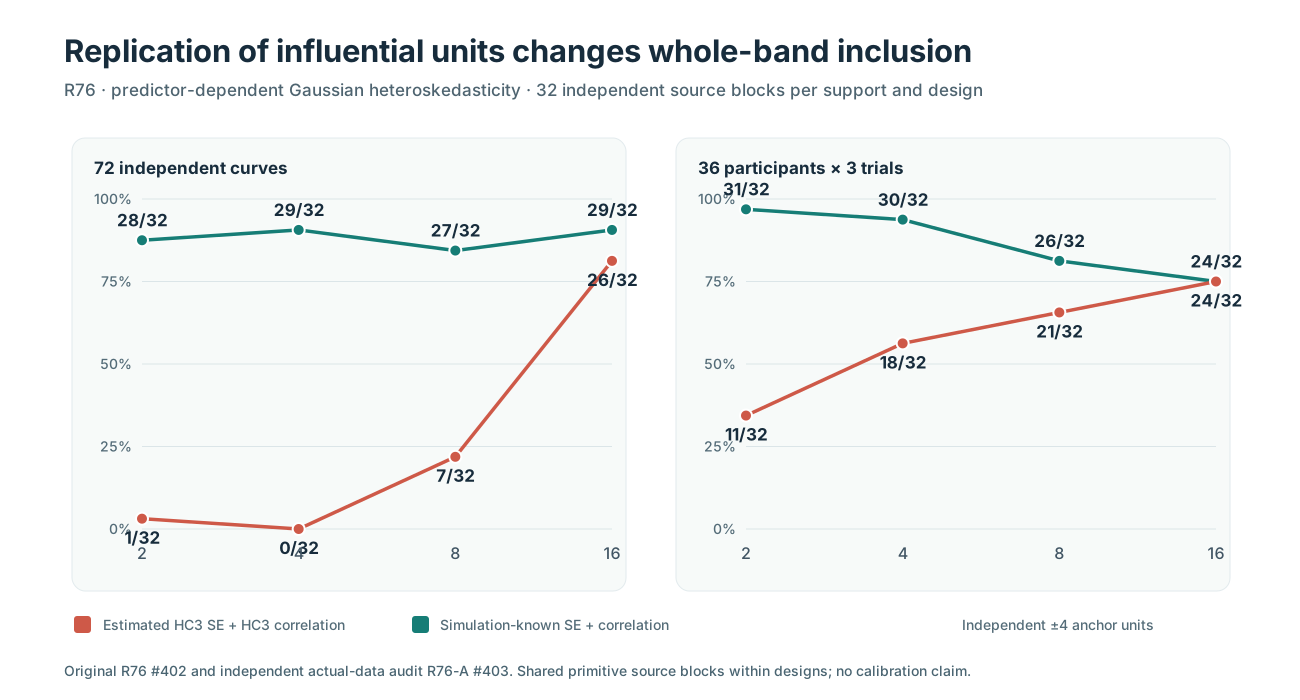
Figure 1. Independently audited numbers of whole-slope-function truth inclusions for nominal 90% bands under predictor-dependent heteroskedasticity. The denominator is always 32 new independent generating blocks per design and anchor count. Experimental conditions are paired within block; the known-law reference uses synthetic generating covariance and is not an implementable real-data estimator.
| Independent extreme units | Curves: HC3 / known law | Participants: HC3 / known law |
|---|---|---|
| 2 | 1/32 / 28/32 | 11/32 / 31/32 |
| 4 | 0/32 / 29/32 | 18/32 / 30/32 |
| 8 | 7/32 / 27/32 | 21/32 / 26/32 |
| 16 | 26/32 / 29/32 | 24/32 / 24/32 |
Here HC3 means estimated slope-weighted HC3 marginal SE crossed with the estimated HC3 Gaussian correlation maximum-statistic reference. Known law means both the actual generating-law slope SE and its Gaussian correlation reference. It does not mean HC3 confidence intervals corrected using an empirical threshold selected after observing the results.
The contrast is large for independent curves when 16 rather than two extreme units are observed: 1/32 versus 26/32 HC3 source-level truth inclusions. Nevertheless, the sequence is not monotonic (1, 0, 7, 26); participants also show a different trajectory (11, 18, 21, 24). With 32 blocks per condition, these empirical frequencies retain substantial Monte Carlo uncertainty. A successful local stress test is not a 90% calibration demonstration over realistic gaze designs.
What changes in the information geometry?
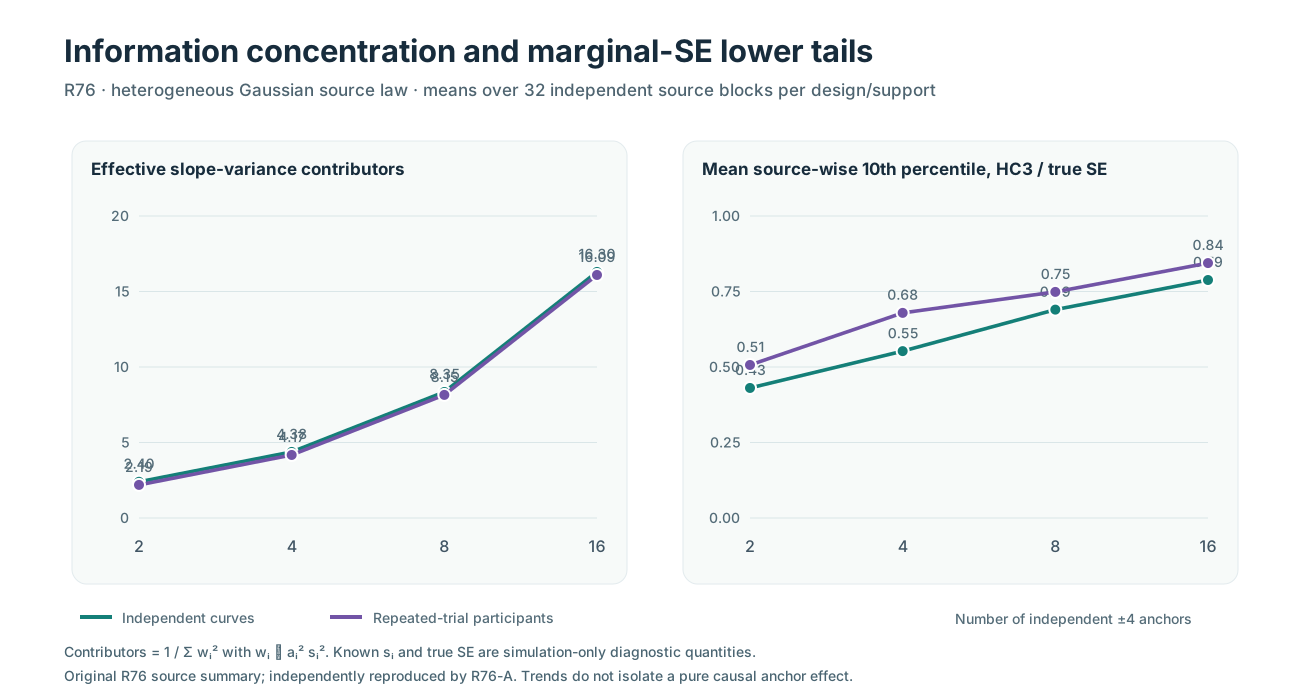
Figure 2. Source-audited means of the analytic true slope-variance contributor concentration index and the source-specific 10th percentile across the 62 grid points of estimated HC3 SE / true SE. Both diagnostics are generating-law quantities. They are not data-driven criteria for automatically choosing a confidence method.
| Heteroskedastic design | Effective variance contributors: 2 → 16 anchors | Source-specific HC3/true SE 10th percentile: 2 → 16 anchors | Mean HC3/true SE: 2 → 16 anchors |
|---|---|---|---|
| 72 independent curves | 2.40 → 16.30 | 0.431 → 0.788 | 0.971 → 1.014 |
| 36 participants ×3 trials | 2.19 → 16.09 | 0.507 → 0.844 | 0.933 → 1.012 |
The contrast explains why averaging an SE ratio can conceal the most consequential errors for maximum statistics. For example, the mean HC3/true SE ratio for curves with two extreme high-variance observations is 0.971, close to one; the source-specific 10th-percentile ratio averages only 0.431. Many individual grid points can therefore have substantially smaller estimated standard errors, despite the apparently satisfactory global mean. R76 finds that these low-tail ratios improve as independent extreme support increases.
An additional subtlety matters: high-noise anchor observations contribute an increasing proportion of true slope variance even as more extreme independent units are added. The favorable trend is therefore not simply a decrease in their aggregate importance. It reflects how variance is distributed among more independent contributing observations, under a simultaneously changing regression design.
What does the experiment identify?
It supports an information-concentration diagnosis in the specified finite-sample Gaussian mechanisms. With sparse extreme support, even a correctly implemented slope-weighted HC3 procedure may suffer substantial realized SE underestimation at some time/coordinate locations, and the estimated joint reference may compound the problem.
However, changing anchor count also changes the leverage distribution, the design matrix, true slope precision, and allocation of true slope variance. R76 does not isolate a pure causal effect of \(N_{\mathrm{eff,var}}\) or establish a universal sample-size threshold. The simulation-known Gaussian reference is an explanatory benchmark, not a feasible estimator for sensor data.
For publication, the defensible wording is: in these independently audited simulations, increasing independent extreme-predictor support coincided with substantial improvements in estimated simultaneous-band inclusion, especially for independent curves. It is not defensible to claim that 16 extreme observations guarantee validity, that HC3 is generally 90%-calibrated, or that this addresses MNAR gaze loss.
Reproduce and audit
The original source code, prospective protocol, source-level exclusions, 999-draw maxima, SHA256 manifests, and failure-inclusive results are linked through R76 PR #402 and independent R76-A PR #403. The original aggregate is artifact #12252397295; the separate numerical audit is artifact #12253250987. Those GitHub Actions artifacts have finite retention periods; the draft PR source and site-level count ledger preserve the evidence description when downloadable artifacts expire.
For a complete figure-source mapping, see the W3 evidence and plot gallery.
Scientific next gate: prospectively evaluate genuinely data-estimated procedures under small effective independent slope information, covariance misspecification, non-Gaussian behavior and realistic response-dependent dropout, and independently reconstruct results on fresh sources. No new inference API, protected-main research merge, PyPI publication or v1.2 release follows from R76.