Why Student-t errors change functional maximum-statistic inference
Methods companion · 20 October 2026 · eyetrajectoriespy W3 R80
The R80 heavy-tailed robustness experiment addresses a methodological issue that remains even when regression estimates, HC3 covariance factors and Gaussian simulation code have been independently verified: correctly computing an estimated Gaussian maximum-statistic reference does not guarantee that it describes heavy-tailed source-level uncertainty.
The experiment uses entire independent-unit trajectories with Student-t5 radial shocks, rather than independently drawing Student-t5 errors at each timestamp. Its meaning depends on preserving that distinction.
Known-source reference is not an observed-data option
R80's Student-t5 degrees of freedom and covariance are known because they are stipulated by simulation. Independent numerical reconstruction supports this exact model's reproducibility; it does not establish generally valid 90% bands in real gaze recordings. The research implementation remains unreleased, with W3 #289/#296 open.
1. A functional Student-t shock belongs to an independent unit
Imagine a participant's two-coordinate time series from three repeated trials. When repeated observations from that participant share a latent source of variation, they should not be modeled as 108 independent observations merely because three trials are recorded for 36 participants.
R80 constructs the independent-unit innovation by multiplying a correlated Gaussian functional process by one radial scale per participant or independent curve:
Thus a participant can experience an unusually large shock that affects both coordinates across the whole time grid and all three trials. This is fundamentally different from 62 mutually independent univariate t random variables, or a single radial factor shared by every participant.
The five-degree-of-freedom scaling preserves the unit-level covariance when it exists because the expected squared scale is one. Matching covariance does not imply matching the distribution of the largest standardized error; heavy tails are precisely the circumstance where those two descriptions can diverge.
2. The source-known benchmark needs a different joint reference
The R79 source-known Gaussian reference could simulate the standardized slope process directly, because a weighted sum of independent Gaussian unit processes is Gaussian with a predictable covariance.
With R80's independent unit-level radial scales, conditioning on those scales still yields a Gaussian sum, but its variance changes for each Monte Carlo draw. If \(a_i\) is the slope weight and \(s_i\) the heteroskedastic unit scale, the known generating-law reference must multiply a fresh normalized Gaussian functional process by
Generating one global Student-t random scale would be incorrect for this design; it would impose a different dependence structure between units. Reusing the Gaussian reference from R79 would also be incorrect. The source-known benchmark therefore reconstructs the independent-unit normal variance mixture before extracting the maximum absolute deviation across the entire 31 × 2 grid.
This benchmark uses true generating parameters only for simulation diagnosis. The four observed-data candidate references—unchanged wild-HC1, original HC3 Gaussian, and fixed λ=.25/.50 HC3 regularizations—are not supplied that privileged knowledge.
3. The source is the denominator, not each bootstrap draw
R80 contains 256 factorial source-condition cases from 32 new independent primitive generating blocks evaluated under two native-unit designs, two predictor-support conditions and two unit-variance laws. In a given condition, the denominator for a complete functional slope truth-inclusion frequency is 32 independent generated datasets.
Each of the five maximum-statistic references retains 999 conditional draws per source. Those draws estimate one source's critical value; they do not increase the number of independent source replications.
A source counts as one success only when all 62 generating slope coefficients are contained in the estimated simultaneous band, not merely when a majority of the grid points are covered.
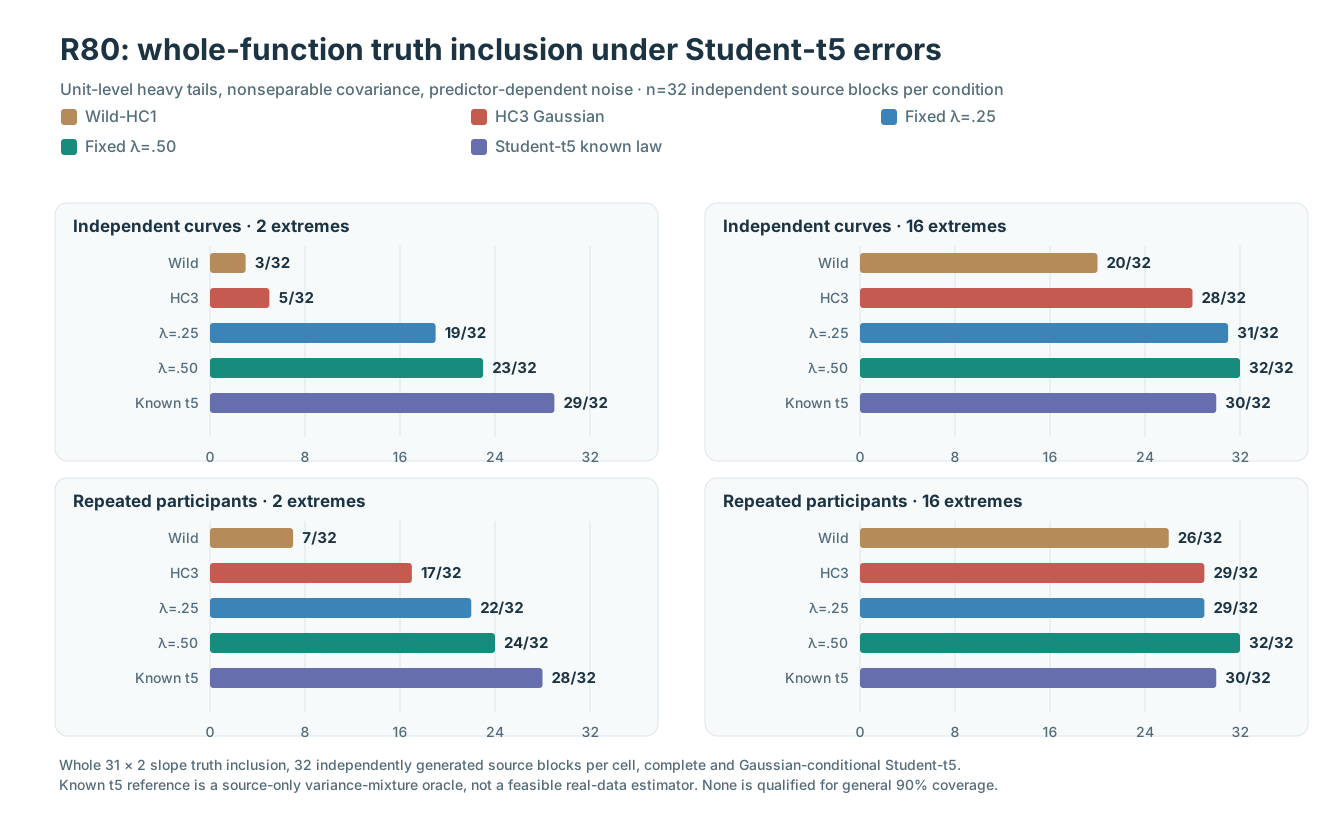
Figure 1. The adverse two-anchor heteroskedastic curve condition has 23/32 successes under frozen λ=.50 regularization, equivalent to 71.9% empirical full-function inclusion, and 29/32 under the simulator-known Student-t5 reference. Those are observed source counts with Monte Carlo uncertainty, not general coverage proofs.
4. Marginal scale and joint critical need to be interpreted together
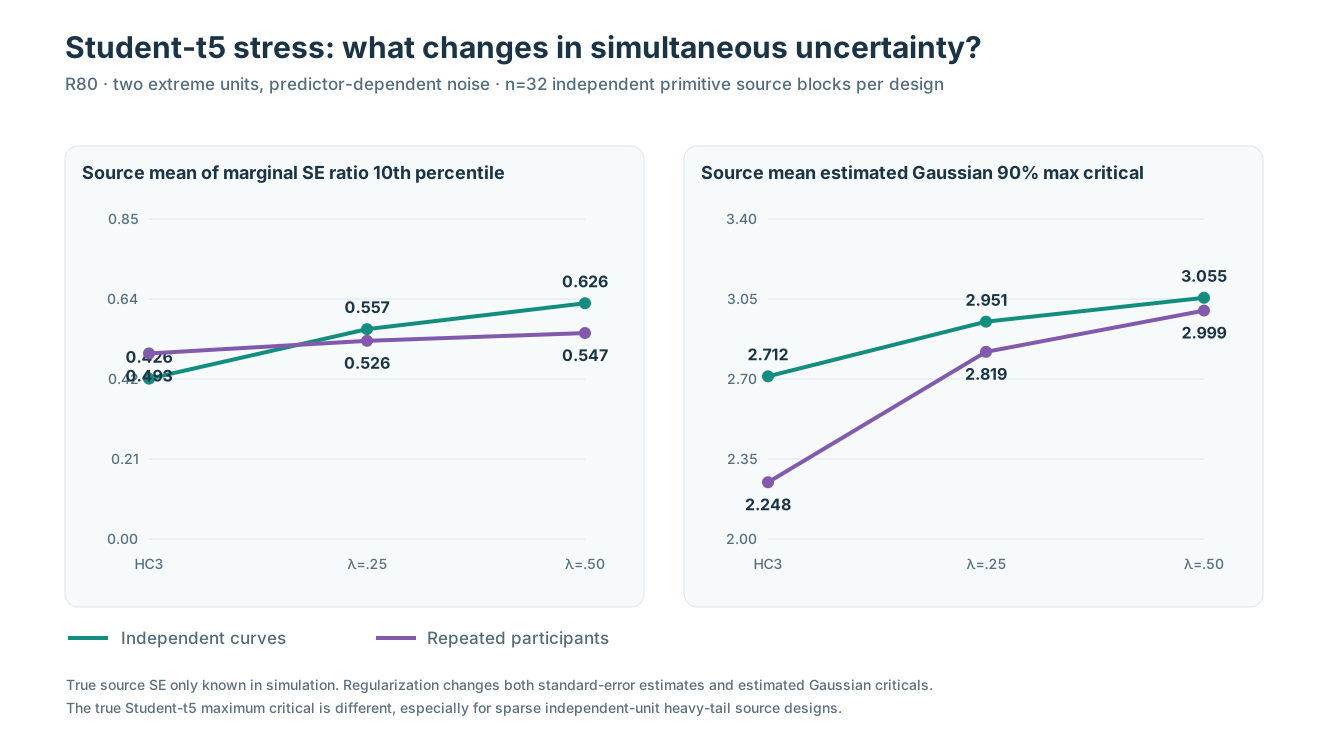
Figure 2. Fixed regularization changes the marginal estimated slope-SE function and the estimated Gaussian maximum-statistic critical. A higher critical may widen the resulting band even if the covariance matrix remains misspecified. The estimated/true SE ratio plotted here is meaningful only because the simulator knows the generating slope variance.
In heavy-tailed settings, neither correct marginal covariance nor numerical agreement between independent implementations guarantees the tail probability of the maximum statistic. It is necessary to report actual generating-function inclusion, critical distributions, failures and the correct independent source denominator.
5. What comparing R79 with R80 can and cannot say
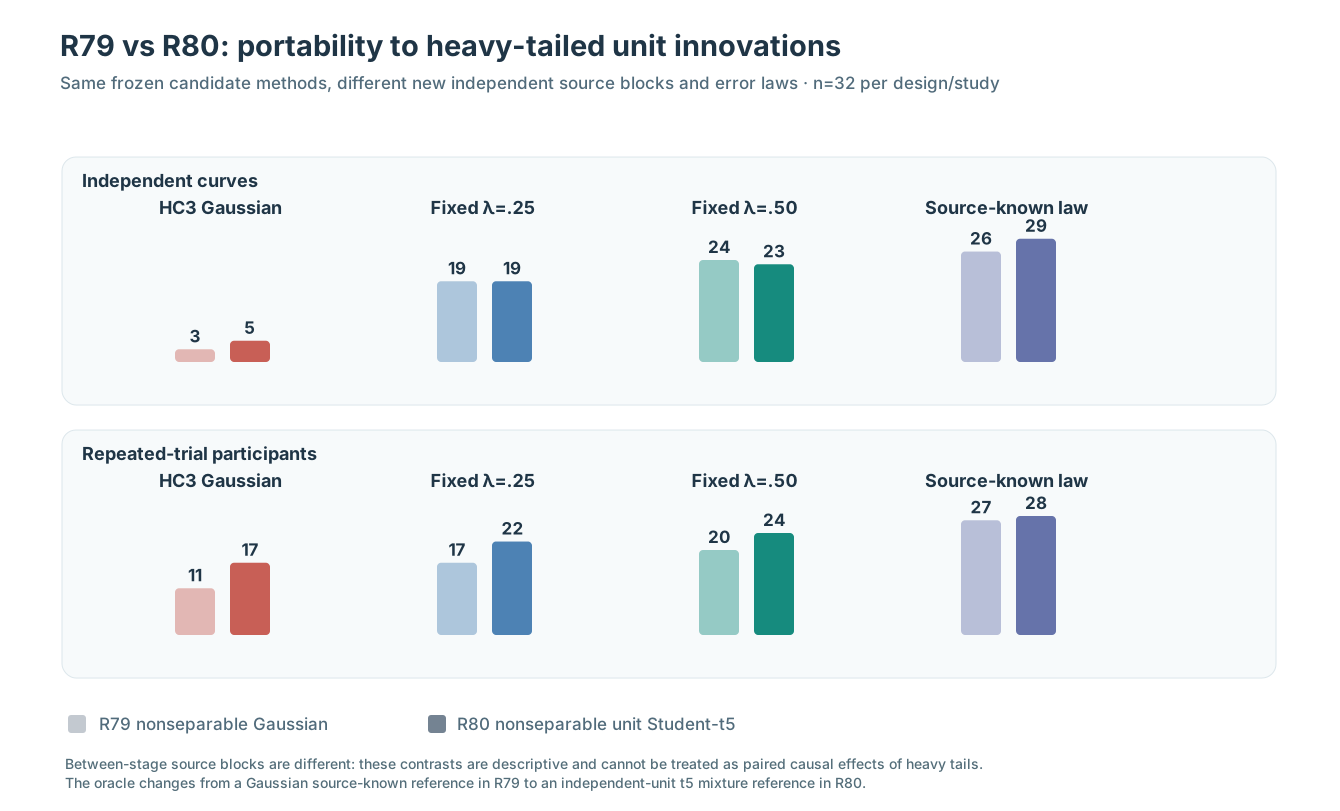
Figure 3. R79 and R80 used different newly generated primitive source datasets. They share the frozen candidate algorithm and many covariance features, but their reported counts cannot be analyzed as if every R79 source was experimentally paired with one R80 source.
Within a single R80 condition, all methods are applied to the same 32 sources, enabling source-matched comparisons of which methods include the generating slope on each dataset. Between R79 and R80, the descriptive counts are useful for identifying a possible transportability issue, but are not themselves a paired causal test of the Student-t modification.
6. Why independent numerical verification remains necessary but insufficient
The R80-A implementation independently recreated 256 original Gaussian-conditional Student-t5 X/Y source datasets and all 1,278,720 original reference maxima, including the correct unit-radial Student-t mixture and original SHA256 archive identity. The original 12/12 scientific workflow and 4/4 independent audit passed.
This makes the reported synthetic experiment numerically reproducible, within the tested tolerances. It does not validate source distributions in real recordings, solve dropout or response-dependent missing gaze, or qualify a generally robust 90% inference method.
The next separately frozen falsification should investigate contamination or skewed innovations and the resulting source failures, followed by observation-process modeling and missingness under issue #296. The release boundary remains unchanged.
Read the full R80 study · R80 numerical source and figure ledger · Previous R79 source-law experiment