Do functional confidence bands survive heavy-tailed independent-unit errors?
Scientific research article · 20 October 2026 · R80 and separate original-source R80-A audit
Research evidence, not a qualified confidence-band method
The results below use fully synthetic, complete-grid Student-t5 source trajectories, not recorded human eye tracking. Fixed covariance-regularization candidates live in unreleased R80 research PR #414 and independent source-audit PR #415. None demonstrates general nominal-90% simultaneous coverage. W3 inference blocker #289 and missingness blocker #296 remain open; stable release 1.1.0 is unchanged and version 1.2 remains on hold.
Why test tails after covariance?
The earlier R79 experiment independently verified that the previously frozen HC3 covariance regularizations can improve model-conditional whole-slope-function truth inclusion under a nonseparable, time-varying Gaussian covariance law. R79 varied spatial and temporal covariance but left independent observational units Gaussian. Gaussian covariance misspecification and non-Gaussian unit-innovation tails are distinct statistical challenges: a covariance estimate can be numerically valid even when its Gaussian maximum-statistic reference mischaracterizes rare unit-level shocks.
R80 asks whether the same two fixed λ candidates, without retuning, retain useful simultaneous inclusion when an entire curve or participant can experience an unusually large shared shock across both gaze coordinates and all time points.
The prospectively frozen independent-unit Student-t5 source
The R80 source protocol was committed before the new experimental outcomes. The 31-time × 2-coordinate source retains the R79 conditional Gaussian correlation structure: time-scaled AR(1) trial errors with rho 0.72, trial marginal SD 0.04(0.70+0.60t), changing trial coordinate correlation q(t)=0.15+0.65t and, in repeated participants, a separate correlated Gaussian participant latent effect.
The innovation changes at the independent unit level, not independently at each gaze sample. For an independent curve or participant i, sample one scale:
The original conditional Gaussian unit trajectory is then multiplied by R_i, the same radial factor across all times, both coordinates and all three trials for a participant. Since E(R_i²)=1 for this scale, the generating marginal covariance retains the R79 structure, but the distribution of unit-level functional shocks has substantially heavier tails. This is a multivariate Student-t5 normal scale mixture per independent unit, not 62 unrelated univariate Student-t errors.
The factorial holds 32 genuinely new primitive generating blocks, independent curves n=72 or participants n=36 with three complete trials, 2 or 16 independent x=±4 extreme predictor observations and constant versus predictor-dependent unit scale 1+0.75|x|. There are 256 case evaluations, but only 32 independent source blocks per fixed design/support/variance cell. Source innovations are paired across conditions within a primitive generating block. This experiment tests neither t distribution skewness nor data missingness.
An essential change: the source-known reference is not Gaussian
A known-Gaussian-covariance maximum reference would be scientifically incorrect under Student-t5 innovations. Therefore, the fifth reference is an exact Gaussian variance-mixture benchmark conditional on the original source design, with independently generated unit-level Student-t5 scales. If a_i are the slope's OLS design weights and s_i its unit-specific known heteroskedastic scale, each reference draw b calculates
The simulator generates a new unit-normalized trajectory from its stipulated nonseparable Gaussian covariance, multiplies its whole standardized slope trajectory by Q_b, and evaluates the largest absolute deviation over all 62 coordinates. This yields the source's true conditional Student-t5 slope sampling law because, conditional on the independent radial scales, the weighted sum of independent Gaussian unit processes remains Gaussian with variance proportional to the squared weighted scales. Neither this true-source distribution nor the simulator-known radial parameters are available to an observed-data analyst.
The other four references remain unchanged: original W3 Rademacher wild-HC1, estimated slope-weighted HC3 Gaussian, and two fixed positive-definite estimated HC3 covariance regularizations with λ=.25 and λ=.50 and the unchanged seven-time-point within-coordinate diagonal smoother. Each reference uses 999 raw conditional maximum-statistic draws per original source; each nominal-90% critical uses the same higher empirical 90th percentile. These 999 draws are not 999 independent source datasets.
Full-function inclusion with predictor-dependent noise
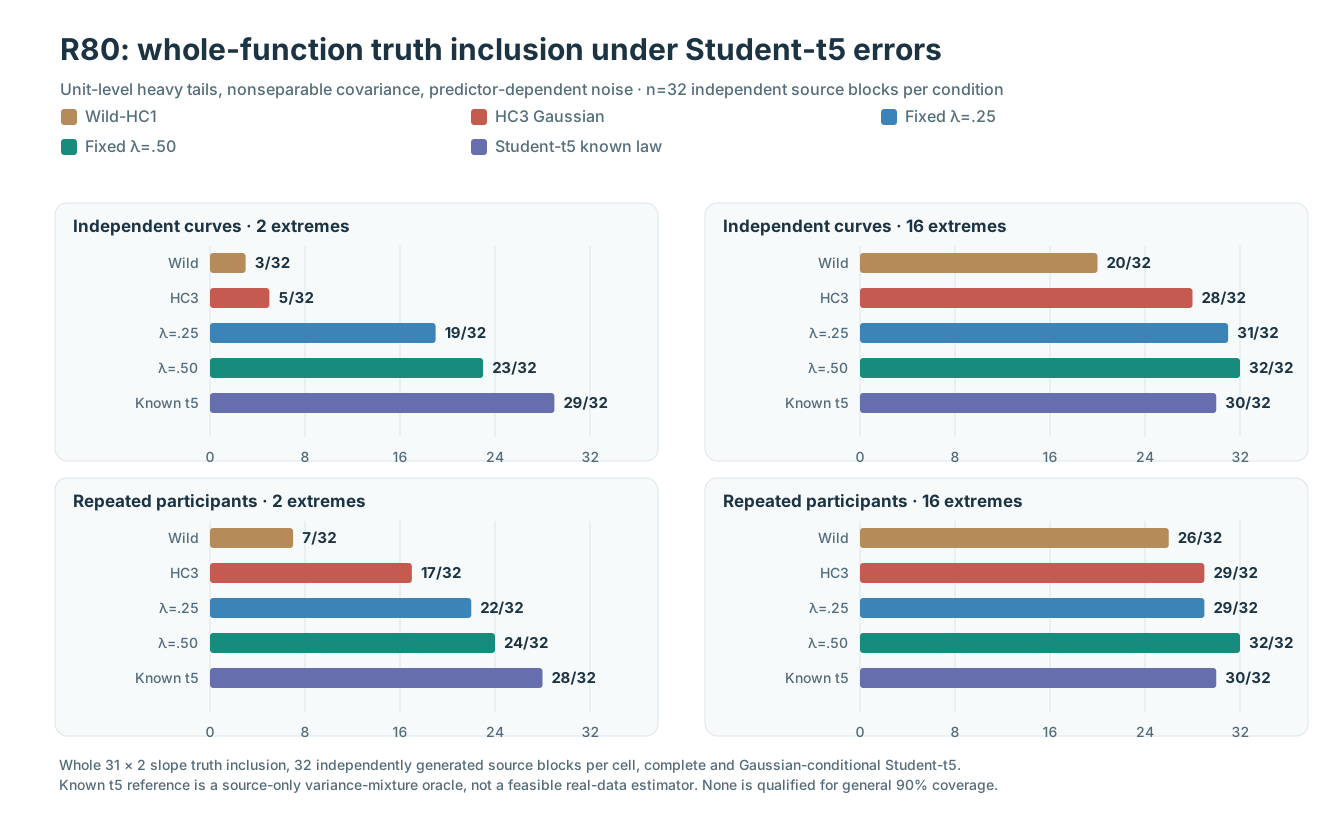
Figure 1. The success event requires all 31 × 2 generating-slope coordinates to lie inside the source-specific simultaneous band. Each cell has 32 independently generated source datasets. The known Student-t5 mixture reference exists only in simulation.
| Nominal-90% whole-function reference | Curves, 2 anchors | Participants, 2 anchors | Curves, 16 anchors | Participants, 16 anchors |
|---|---|---|---|---|
| Original W3 wild-HC1 | 3/32 | 7/32 | 20/32 | 26/32 |
| Original data-estimated HC3 Gaussian | 5/32 | 17/32 | 28/32 | 29/32 |
| Frozen λ=.25 covariance Gaussian | 19/32 | 22/32 | 31/32 | 29/32 |
| Frozen λ=.50 covariance Gaussian | 23/32 | 24/32 | 32/32 | 32/32 |
| Source-known Student-t5 mixture benchmark | 29/32 | 28/32 | 30/32 | 30/32 |
Under the adverse two extreme high-noise independent units design, the estimated HC3 Gaussian method includes the true entire slope in only 5/32 curve datasets and 17/32 participant datasets. Fixed λ=.50 increases this to 23/32 and 24/32 on those same source datasets. This is a substantial source-matched descriptive improvement over baseline HC3; however, 23/32 is 71.9% and 24/32 is 75%, far below a demonstrated 90% target. The simulator-known conditional Student-t5 mixture includes 29/32 and 28/32, respectively. Its observed finite-sample proportions are not a guarantee of calibration for every other generating law.
With 16 independent extreme predictor units, the frozen λ=.50 method includes all 32 observed source functions in both configurations, exceeding the source-known comparator's 30/32 in these particular data. Such 32-source counts do not prove uniform superiority or an appropriately calibrated estimated procedure: they may reflect conservative widening and simulation variability.
Constant-variance falsification cells
The prespecified constant-unit-variance cells are retained, not discarded for a more attractive adverse-case narrative. Under two extreme units, full-slope inclusion among 32 sources for baseline HC3 / λ=.25 / λ=.50 / exact Student-t5 reference is 17/32, 26/32, 28/32, 27/32 for independent curves and 26/32, 28/32, 28/32, 28/32 for repeated participants. The complete 16-anchor comparisons and all source exceptions are archived alongside the adverse results.
Which uncertainty component changes?
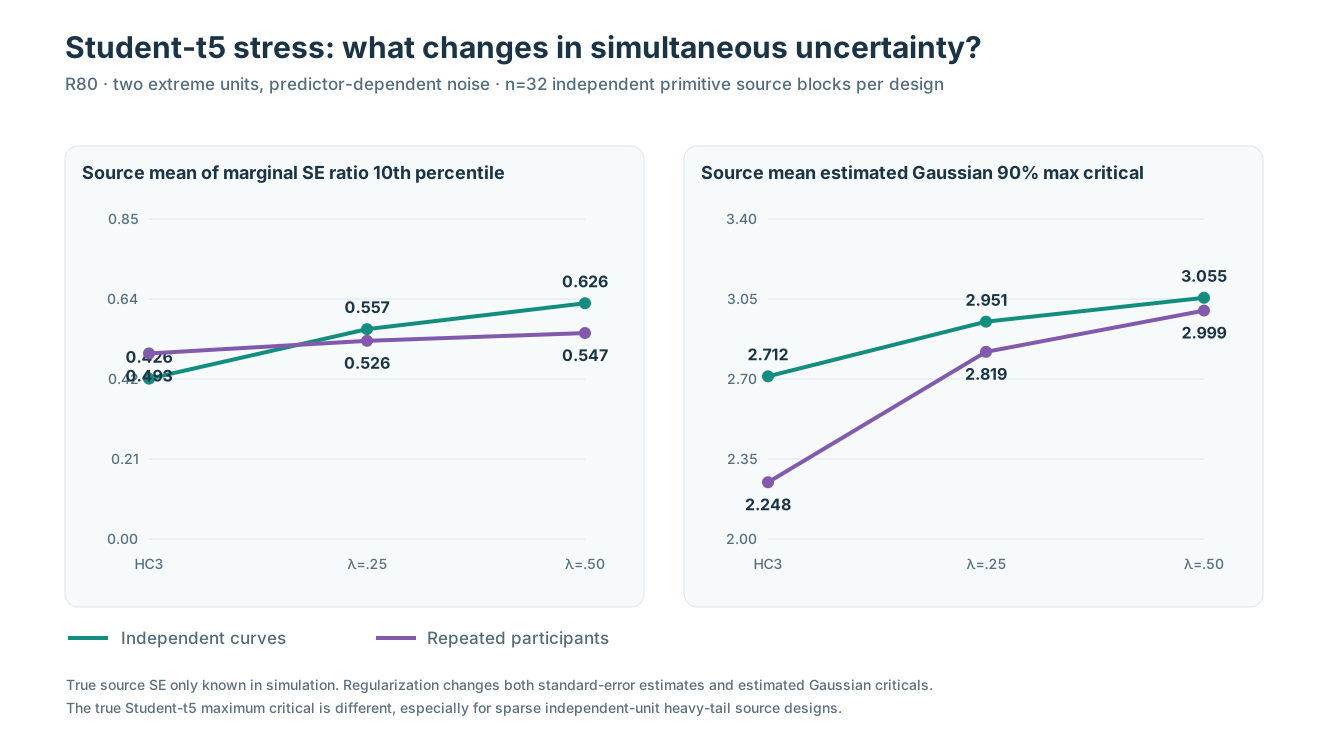
Figure 2. Two-anchor predictor-dependent-variance design. The first panel gives the source mean of each source's 10th percentile, across 62 coordinates, of estimated marginal SE divided by simulation-known true marginal slope SE. The second panel gives each data-estimated Gaussian reference's source-mean maximum-statistic critical. True generating marginal SE is not available from ordinary gaze data.
| Source-averaged diagnostic | Baseline HC3 | Fixed λ=.25 | Fixed λ=.50 |
|---|---|---|---|
| Curves, lower-tail estimated/true SE | 0.426 | 0.557 | 0.626 |
| Participants, lower-tail estimated/true SE | 0.493 | 0.526 | 0.547 |
| Curves, estimated Gaussian maximum critical | 2.712 | 2.951 | 3.055 |
| Participants, estimated Gaussian maximum critical | 2.248 | 2.819 | 2.999 |
Regularization changes both estimated marginal uncertainty and the joint Gaussian maximum critical. Under the adverse two-anchor setting, the known Student-t5 mixture benchmark has mean critical 3.322 for curves and 2.456 for participants. The source-known t reference can be more extreme than the estimated Gaussian reference, but critical values alone must not be compared without their accompanying standard-error scales. A higher candidate critical can widen bands and raise truth-inclusion rates even when true source-specific covariance is still underestimated.
Does the gain transport beyond R79?
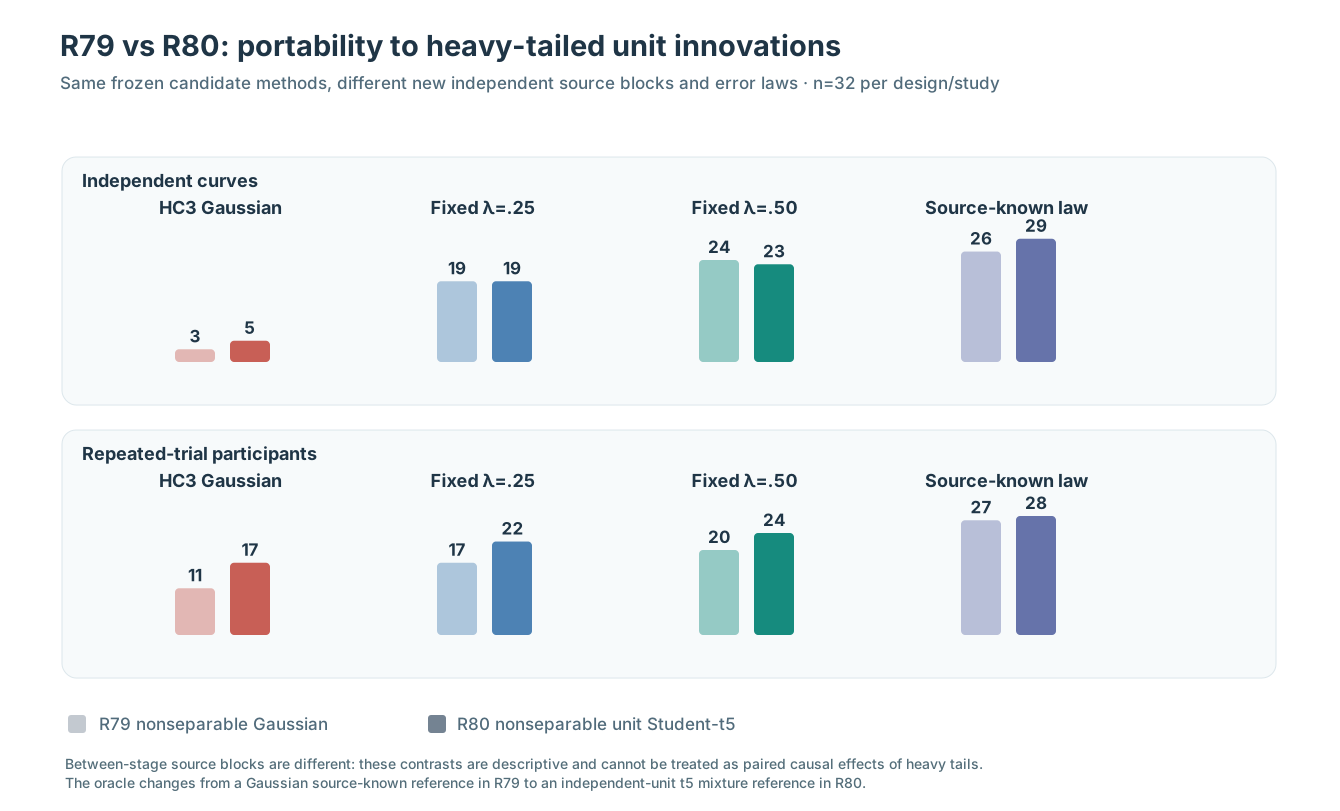
Figure 3. R79 and R80 use different genuinely new primitive source blocks, although several structural source-law components and both fixed regularization strengths are shared. This figure is a descriptive between-study comparison, not a source-paired causal estimate of changing the unit innovation distribution.
| Reference, 2 anchors and heteroskedasticity | Curves: R79 → R80 | Participants: R79 → R80 |
|---|---|---|
| Estimated HC3 Gaussian | 3/32 → 5/32 | 11/32 → 17/32 |
| Fixed λ=.25 | 19/32 → 19/32 | 17/32 → 22/32 |
| Fixed λ=.50 | 24/32 → 23/32 | 20/32 → 24/32 |
| Known generating-law reference (Gaussian → Student-t5) | 26/32 → 29/32 | 27/32 → 28/32 |
The shift to heavy-tailed independent units did not erase every finite-source regularization gain, but it did not resolve the sparse-independent-information calibration problem. It would be an overstatement to infer a causal effect from these unpaired R79 and R80 source counts.
Independent original-source audit and scientific status
The original R80 scientific workflow #39487449656 passed 12/12 dedicated scientific jobs, completing 256/256 new original source cases with zero refusals. The immutable original evidence archive #12293409344 records the exact scientific original source checkout c3c590788a8d126c73e59d7e0e799d6f39f0d655.
A separately coded R80-A actual-original-source audit #39487811433 passed 4/4 independent scientific jobs, independently reconstructing the 256 original X/Y datasets, 1,278,720 original conditional reference maximum-statistic values, source-specific Student-t5 radial factors, mixture oracle criticals, estimated HC3 and regularized covariance matrices, all full-grid truth-inclusion events and SHA256 source identities. The independent replay evidence #12294940973 is retained separately from the original source archive.
These two successful workflows establish numerical reproduction of this specified model-conditional simulation, not general frequentist validity, and do not convert the known-source Student-t mixture into an implementable observed-data inference algorithm.
Interpretation and next scientific gate
R80 tests independent-unit elliptically symmetric Student-t5 shocks with finite variance, and indeed finite fourth moment, while preserving complete observation, fixed time grid, Gaussian conditional spatial-temporal correlation and prespecified predictor support. It says nothing directly about skewness, arbitrary contamination, nonignorable observation loss, irregular sampling or true detector error.
The next research gate must avoid treating the nominal level in a conditional reference as proven calibration. A justified progression is contamination and mixed-unit variance/fail-closed source robustness, then explicit response-dependent gaze loss and source-independent numerical replay, with all source attempts retained.
Release decision unchanged: no general 90% simultaneous-band qualification; W3 #289 and #296 stay open, stable 1.1.0 unchanged, and eyetrajectoriespy 1.2/PyPI release remains on hold.
Read previous R79 covariance experiment · How to interpret W3 source audits · R80 source and plot ledger