Scientific figure atlas
Filter and search selected figures — a source-linked curated view with representation, inference and missingness filters. The full atlas remains below.
Figures are grouped by the question they answer, rather than by the order in which they were created. Example plots are deterministic synthetic illustrations. Research plots document specifically frozen experiments and should not be generalized beyond their archived assumptions.
A. Understand the functional gaze representation
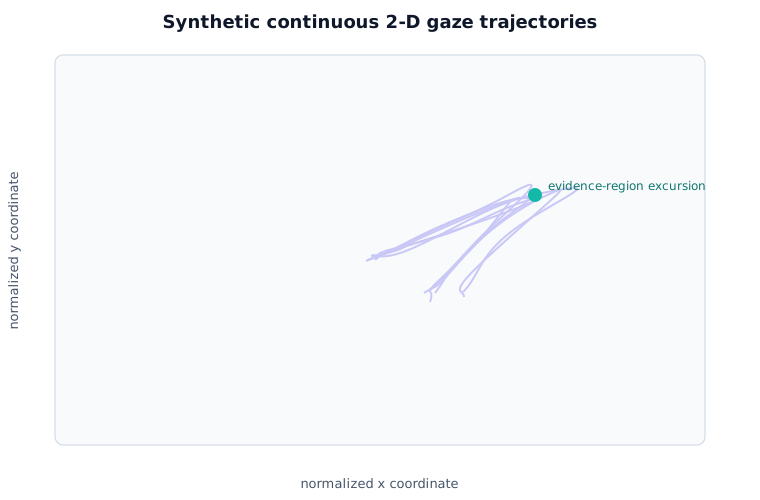
Time-indexed planar trajectories — what we preserve instead of collapsing immediately to counts.
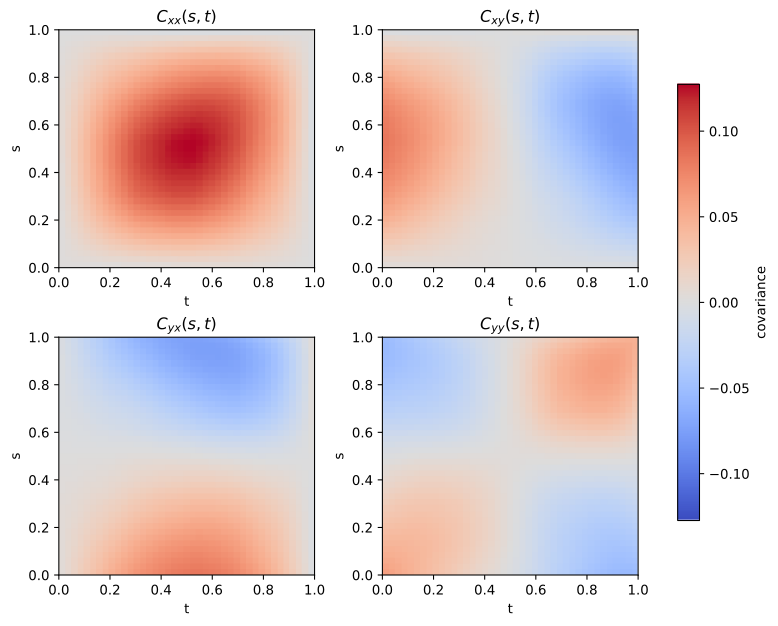
Sparse x/y covariance structure — illustrates modeled covariance, not tracking hardware performance.
B. Functional inference under stress
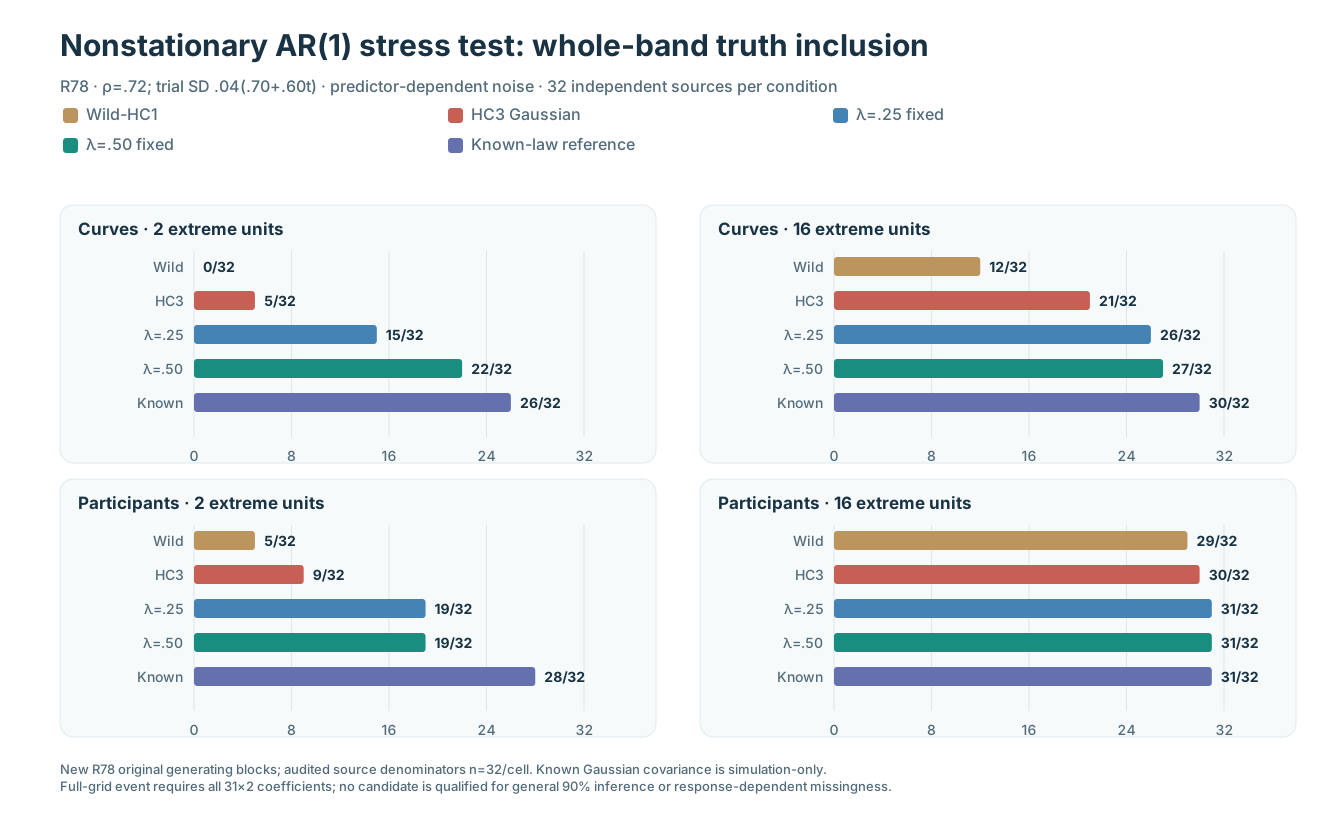
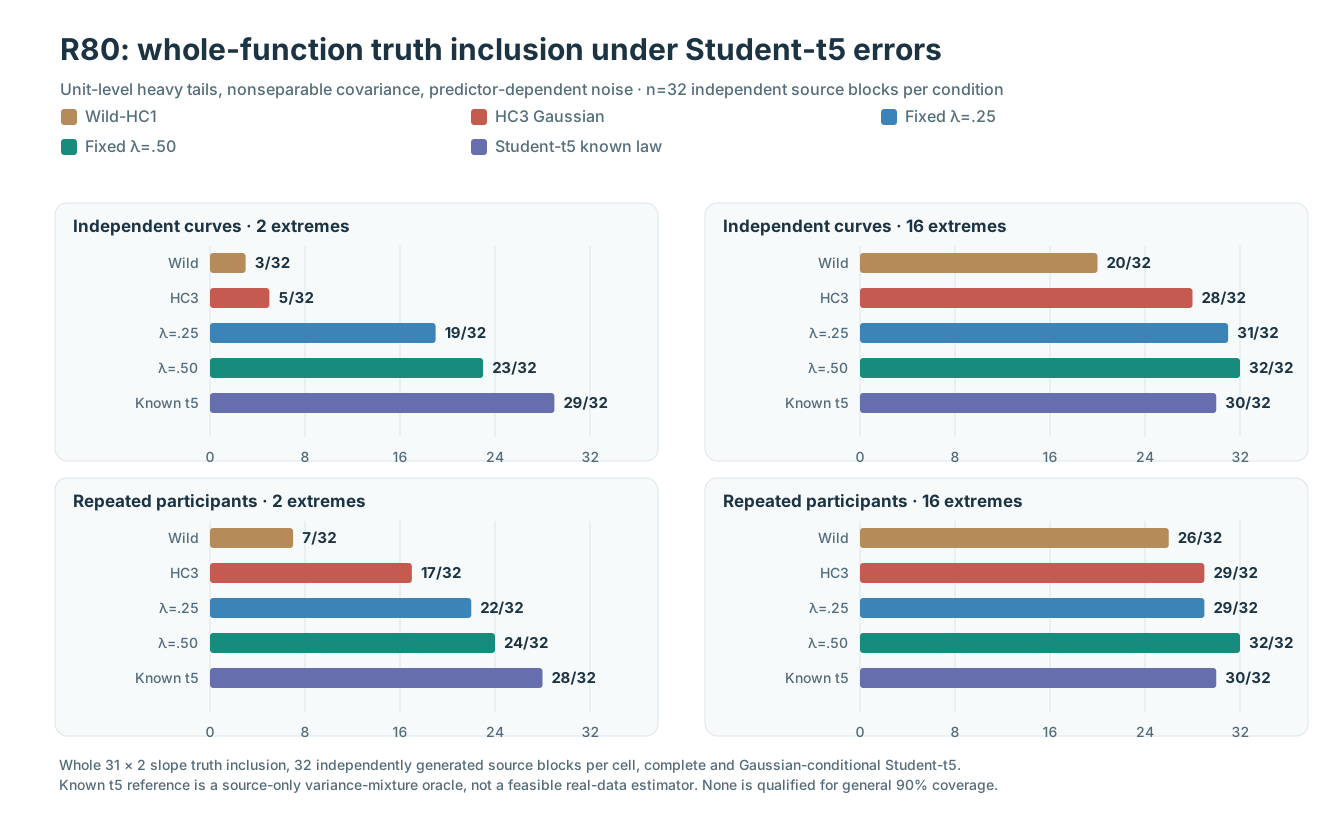
R78 temporal covariance · R80 heavy-tailed units · Independent figure-ledger archive
C. Missingness, audit and exact identified sets
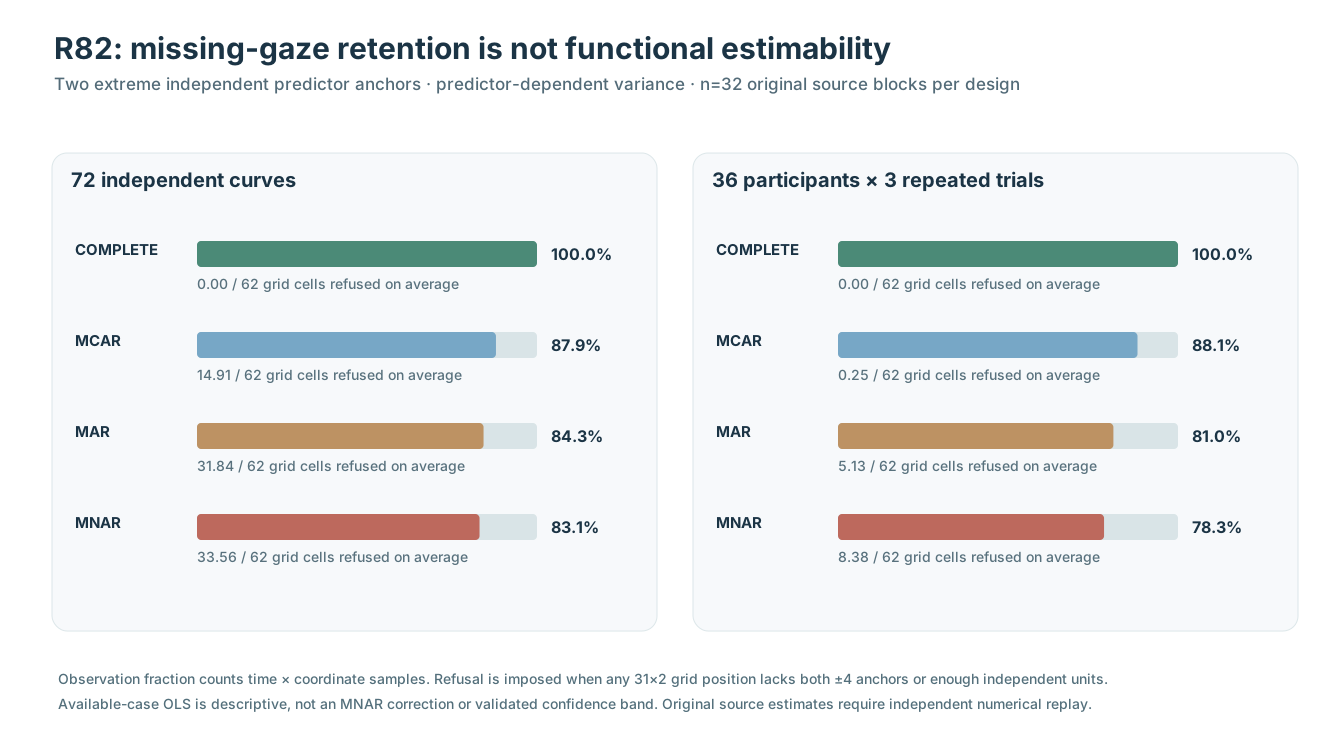
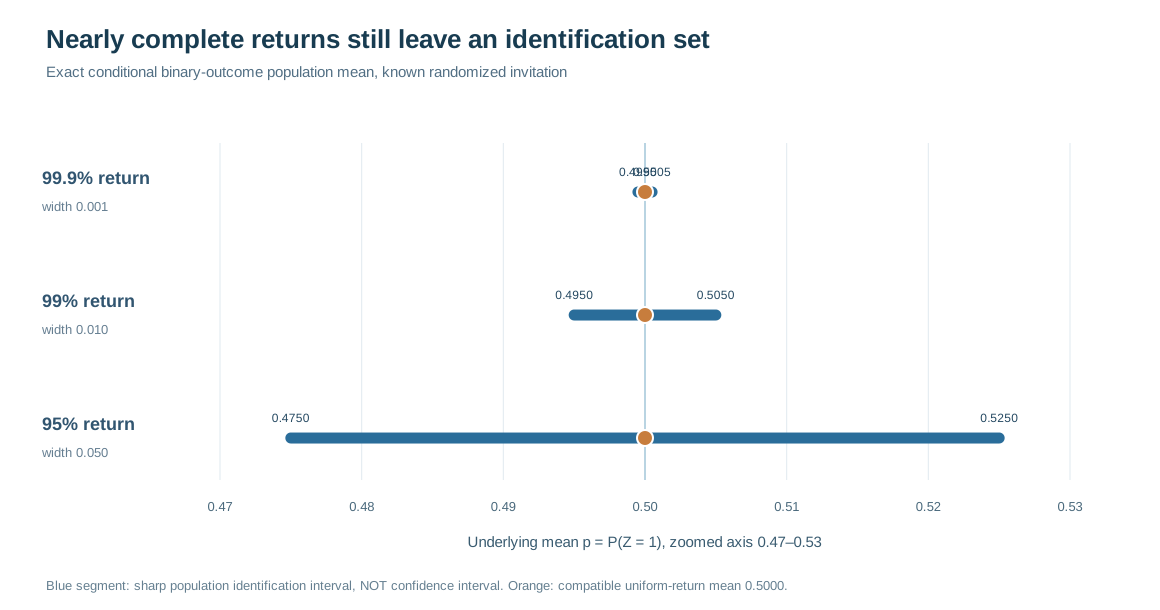
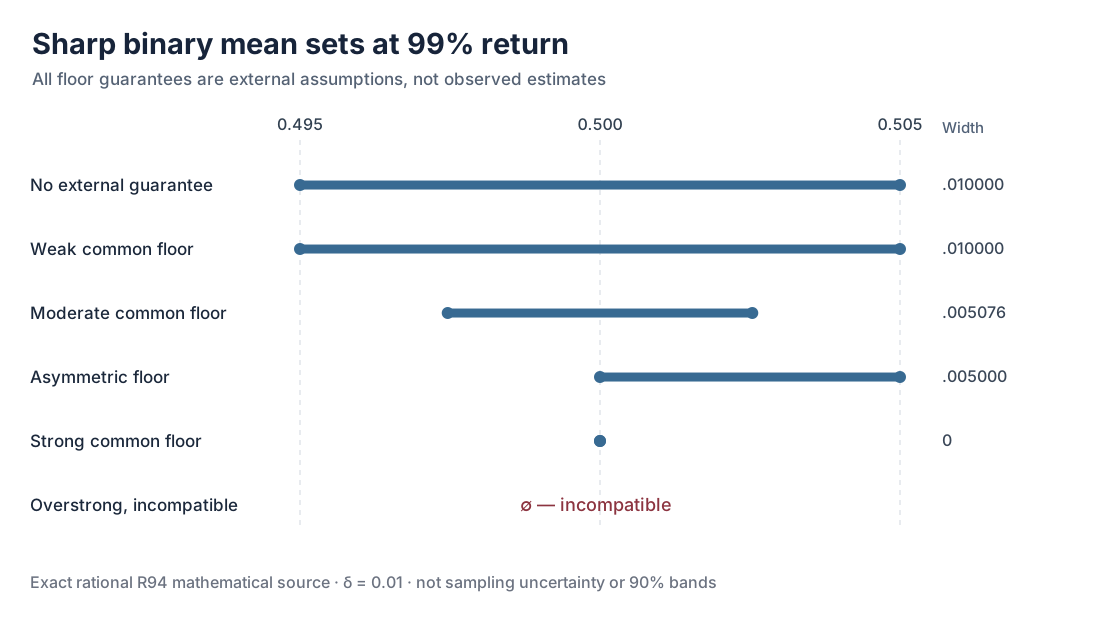
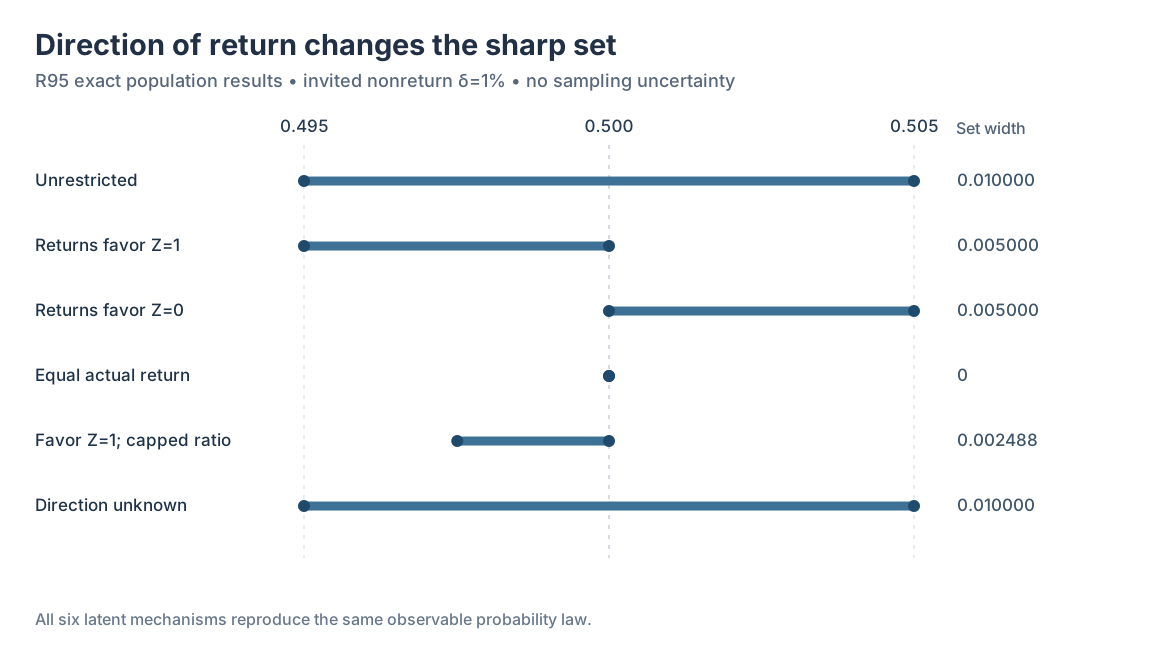
Missing gaze study · Identification methods · All W3 studies
D. Compare conditional missing-outcome assumptions
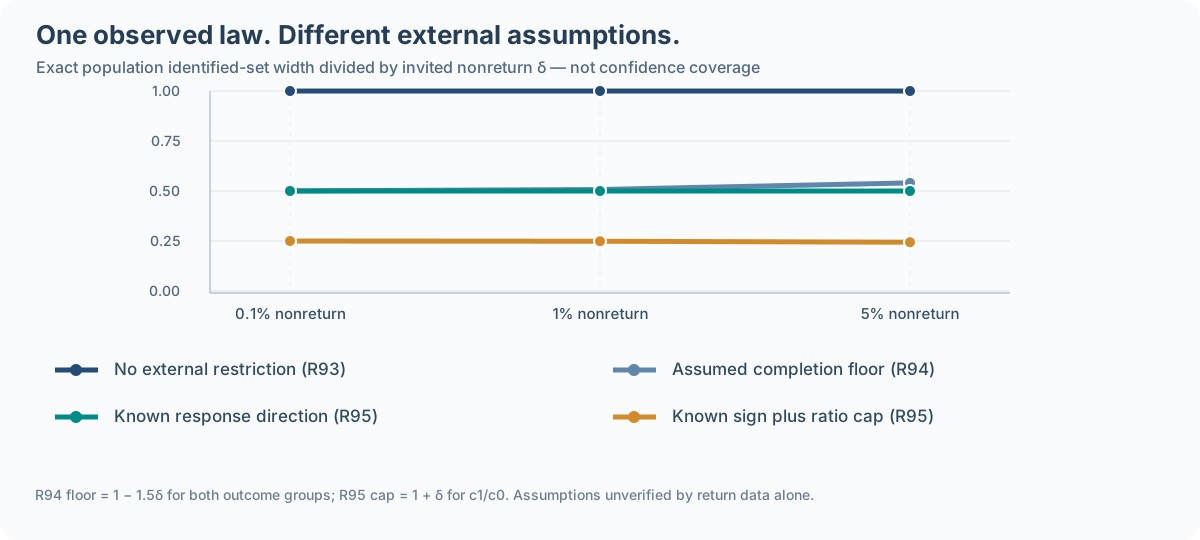
Why different assumptions change the sharp set. These ratios are analytical population identities, not fitted uncertainty or measured gains.
Reproducibility
Read the source-specific evidence ledgers before quoting numeric proportions: R93, R94, R95. See also the full synthetic workflow visual gallery.
Do not treat simulation truth-inclusion as validated coverage
Whole-slope inclusion under a specified generator is not proof of general nominal frequentist calibration. A population identified set is not a confidence band.