E1–E4 experimental result gallery (seeded teaching analysis)
Included in 1.2.0, but explicitly experimental
The E1–E4 helper namespace is distributed with stable eyetrajectoriespy==1.2.0 but remains unstable and outside the ten supported workflow contracts. These figures come from deterministically seeded synthetic teaching data, not human gaze, estimator validation or performance evidence.
Four reproducible figures are generated by scripts/generate_e1_e4_docs_gallery.py and checked during strict MkDocs CI, not manually drawn.
E1 — Declared before/after preprocessing
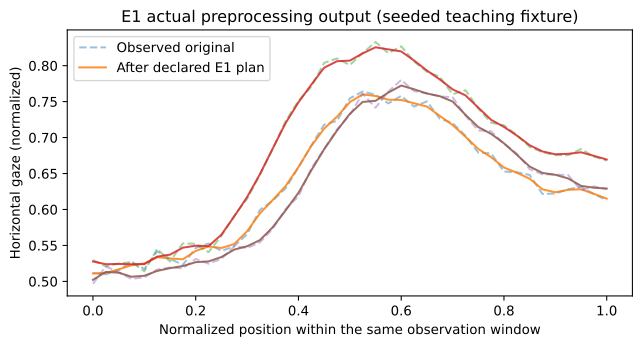
Three curves are shown before and after analyst-declared smoothing and time normalization. Time is displayed as a normalized position; smoothing may attenuate genuine saccades. No records were automatically excluded.
E2 — Observed support and missingness
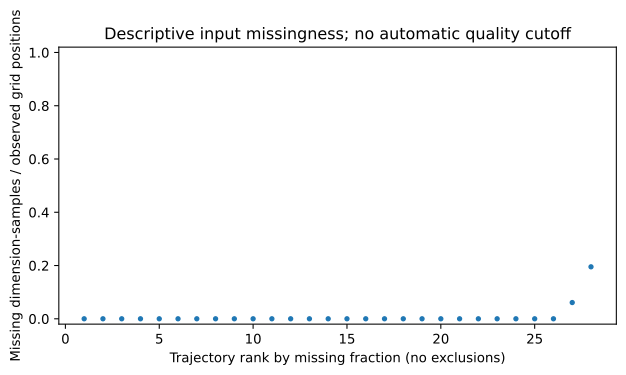
This pedagogical demonstration injects missing samples into a copy of the fixture exclusively for input-QC illustration. The fitted FPCA source remains unmodified. Preflight does not itself exclude curves.
E3 — Specification sensitivity with retained failure
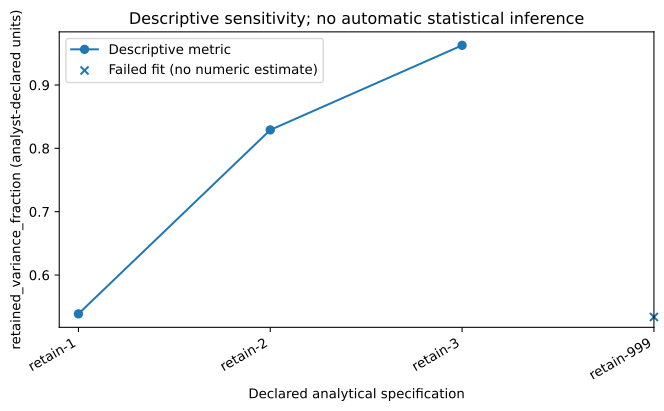
The metric is retained-variance fraction for explicitly chosen component counts. A deliberately infeasible configuration is retained as a failed fit and its plot marker is anchored to the axes margin, not depicted as a zero estimate. This is not an inferential confidence interval or model ranking.
E4 — Actual report evidence
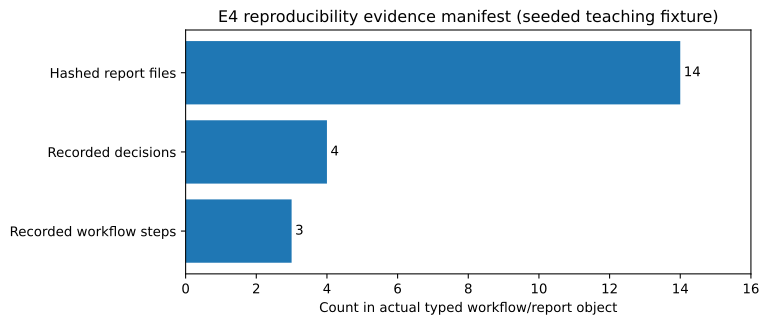
Counts are computed from the actual typed workflow steps/decisions and SHA256-hashed files written by render_workflow_report(); they are not invented example metrics.
For authentic eye-tracking observations with sampling complications, see the separately documented real-gaze E1–E4 usability case. The general visual gallery continues to cover the frozen nonexperimental plotting surface.