Visual gallery
These figures are regenerated from deterministic synthetic data during the documentation workflow. The gallery is therefore part of the tested documentation build rather than a collection of manually exported screenshots.
-
Continuous planar trajectories
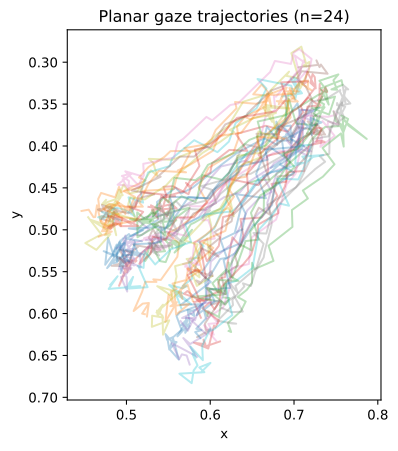
Whole-path inspection before dimensional reduction.
API:
simulate_planar_trajectories(),plot_planar_trajectories() -
FPC interpretation curve
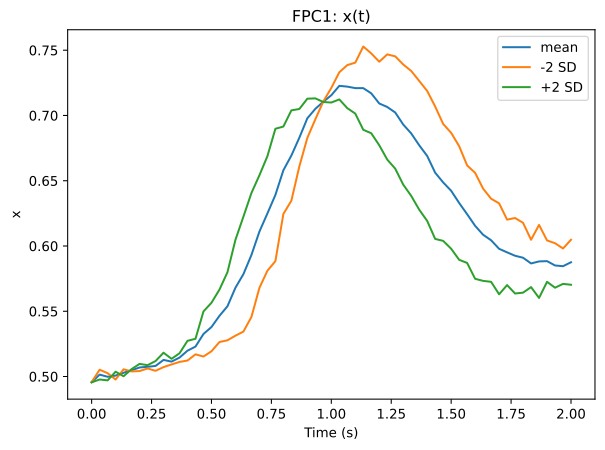
Mean and score-SD perturbations for one functional dimension.
API:
fit_mfpca(),plot_fpca_component() -
Cumulative FPCA variance
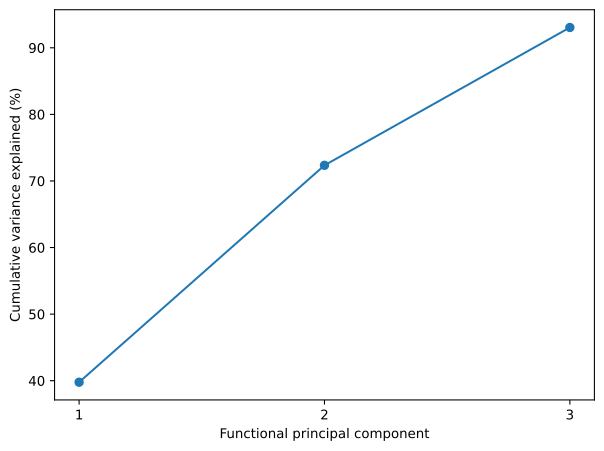
Retained functional variance across the fitted component sequence.
API:
plot_fpca_variance() -
Registration displacement
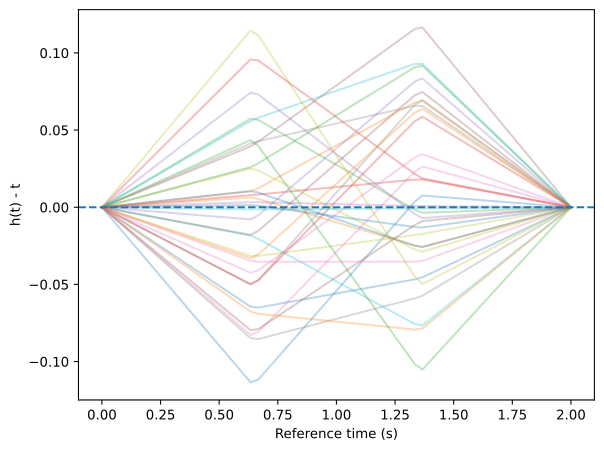
The retained phase displacement (h_i(t)-t), rather than a hidden registration side effect.
API:
register_to_landmarks(),plot_warping_functions() -
Simultaneous functional mean band
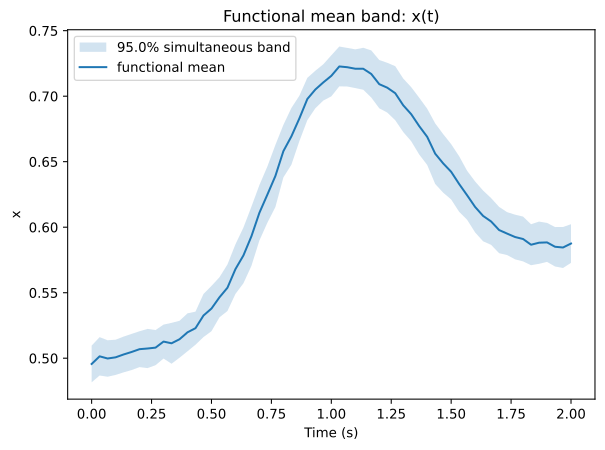
Observed-grid Gaussian multiplier calibration.
API:
multiplier_functional_mean_band(),plot_functional_mean_band() -
Experimental condition coefficient over trial time
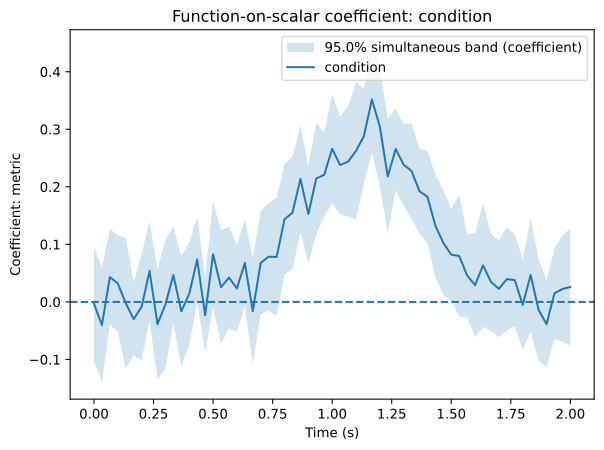
Observed-grid function-on-scalar condition coefficient with a fixed-design wild-bootstrap simultaneous band.
API:
fit_function_on_scalar_regression(),function_on_scalar_simultaneous_bands(),plot_function_on_scalar_coefficients() -
Repeated-measures condition coefficient
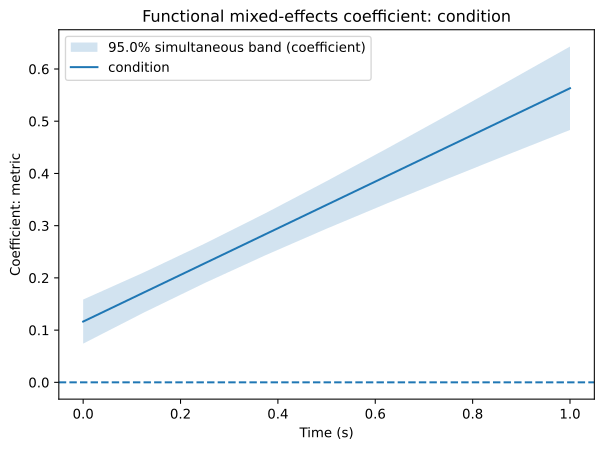
One joint repeated-measures Gaussian functional mixed model with a participant functional random intercept and a participant-cluster observed-grid simultaneous band for the condition coefficient.
API:
fit_functional_mixed_effects_regression(),bootstrap_functional_mixed_effects_coefficients(),functional_mixed_effects_simultaneous_bands(),plot_functional_mixed_effects_coefficient() -
Participant-specific condition-response heterogeneity
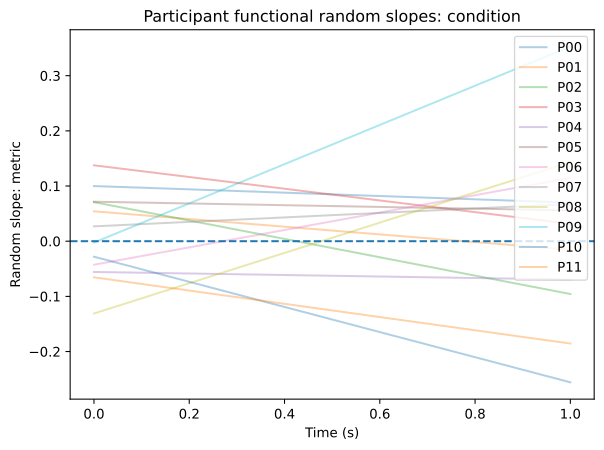
Participant BLUP random-slope functions from one guarded random functional slope for the declared condition predictor. The full intercept/slope covariance, eigenvalues, condition diagnostics, and covariance dimensionality remain part of the fitted result rather than being hidden behind the plot.
API:
fit_functional_mixed_effects_regression(),functional_random_effect_frame(),plot_functional_random_effects() -
Multivariate IAAFT preservation diagnostics
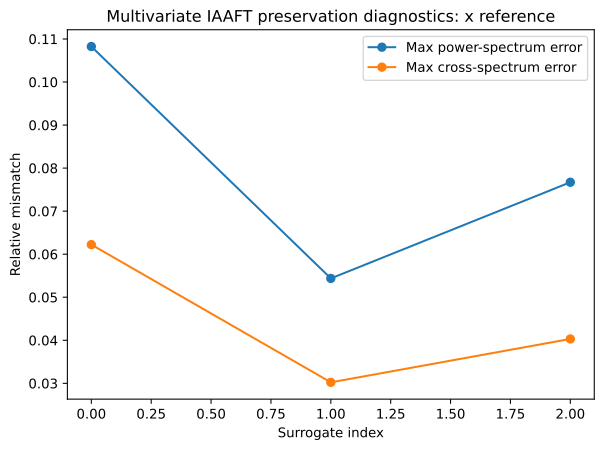
Cross-spectrum-aware x/y surrogate generation with exact marginal rank restoration and explicit retained Fourier mismatch diagnostics.
API:
generate_multivariate_iaaft_surrogates(),plot_multivariate_iaaft_diagnostics() -
Heteroscedastic FPCR target intervals
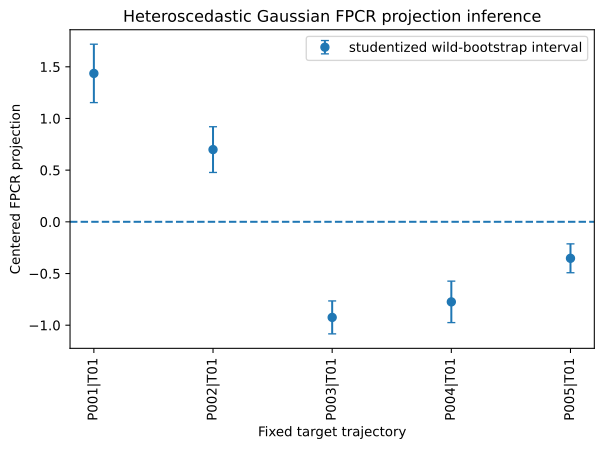
Studentized fixed-regressor wild-bootstrap intervals for centered target projections.
API:
wild_bootstrap_fpca_projection(),plot_fpca_wild_bootstrap_projection() -
Fixed-family wild-bootstrap tests
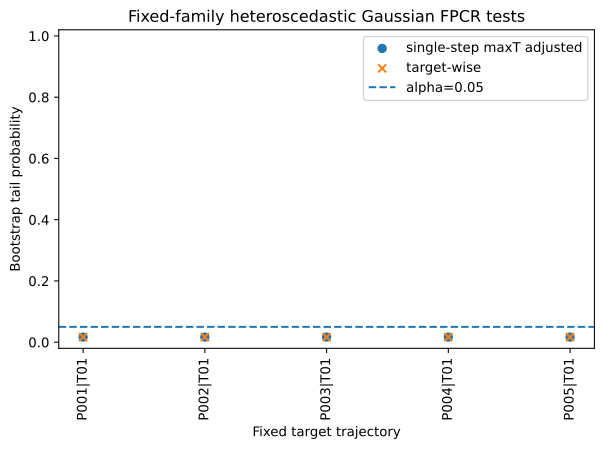
Target-wise and single-step max-(|t|) probabilities for one declared family.
API:
fpca_wild_bootstrap_projection_family_test(),plot_fpca_wild_bootstrap_family_test() -
Finite-bootstrap precision
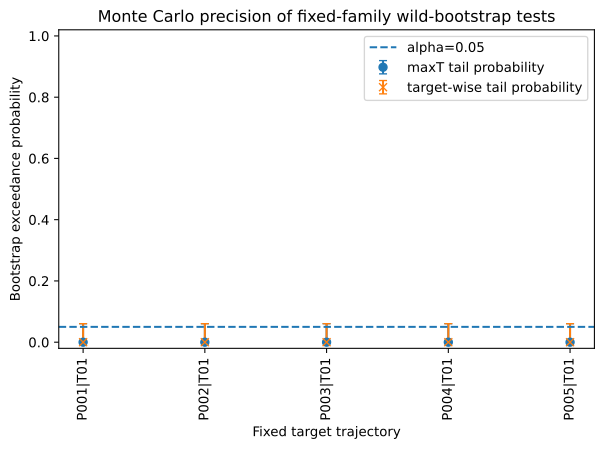
Exact binomial intervals around retained bootstrap exceedance probabilities.
API:
fpca_wild_bootstrap_family_test_monte_carlo_diagnostics(),plot_fpca_wild_bootstrap_monte_carlo_diagnostics() -
Continuous signed curvature
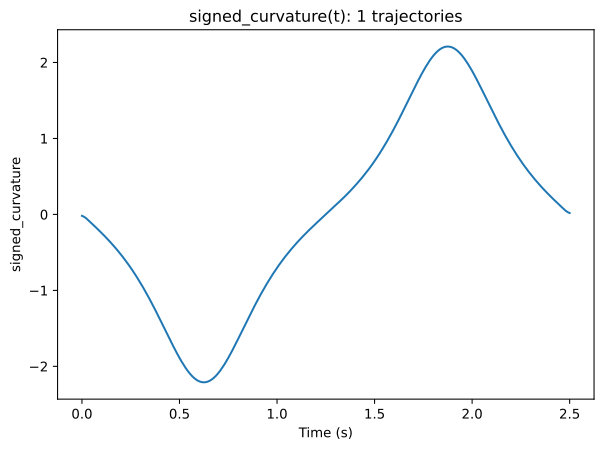
Continuous local path curvature computed from the observed planar trajectory without hidden smoothing, interpolation, or denominator stabilization.
API:
signed_curvature_function(),plot_trajectory_overlay() -
Audited dynamic time warping alignment
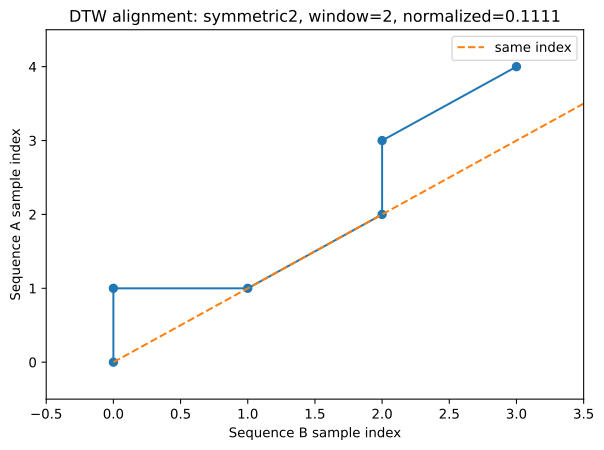
A normalizable symmetric2 alignment with an explicit Sakoe-Chiba sample-index band, shown against the same-index diagonal.
API:
dynamic_time_warping_distance(),plot_dynamic_time_warping_alignment() -
Trajectory-distance robustness
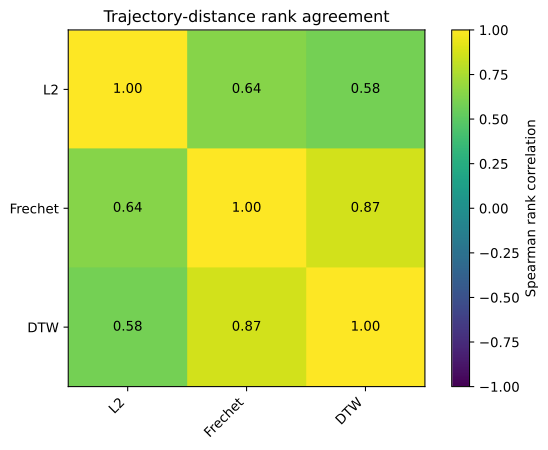
Native-scale distance matrices are compared through pair-distance rank agreement without constructing a consensus metric or choosing a winner.
API:
trajectory_distance_sensitivity(),plot_trajectory_distance_rank_correlations() -
Sparse recurrence structure
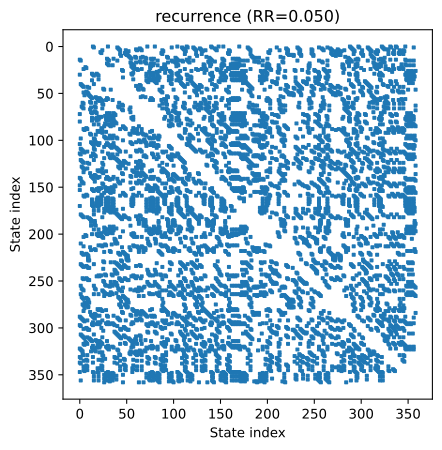
Recurrent reconstructed states under an explicit target recurrence rate and Theiler exclusion.
API:
delay_embed_trajectory(),recurrence_matrix(),plot_recurrence() -
Synchronized joint recurrence
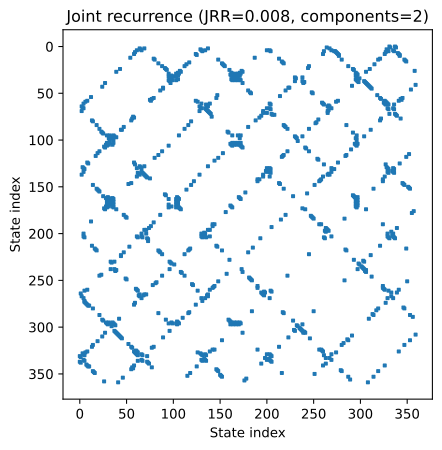
Sparse logical intersection of separately declared auto-recurrence matrices on one exact time grid and shared Theiler exclusion.
API:
joint_recurrence_matrix(),joint_rqa_metrics(),plot_joint_recurrence() -
Sparse recurrence-network degree
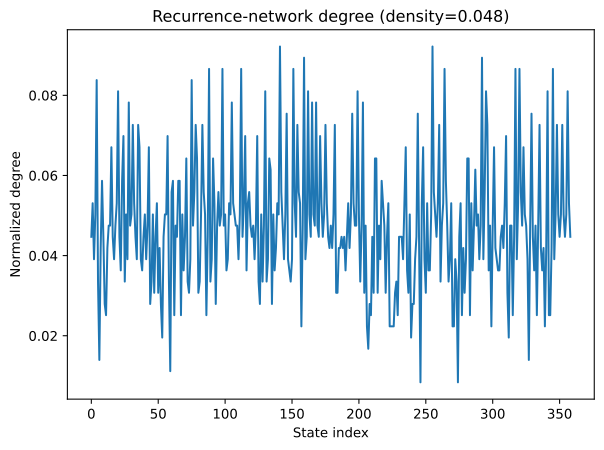
Node degree from the sparse auto-recurrence adjacency, retaining the declared recurrence threshold and Theiler exclusion.
API:
recurrence_network(),plot_recurrence_network_degree() -
Recurrence threshold profile
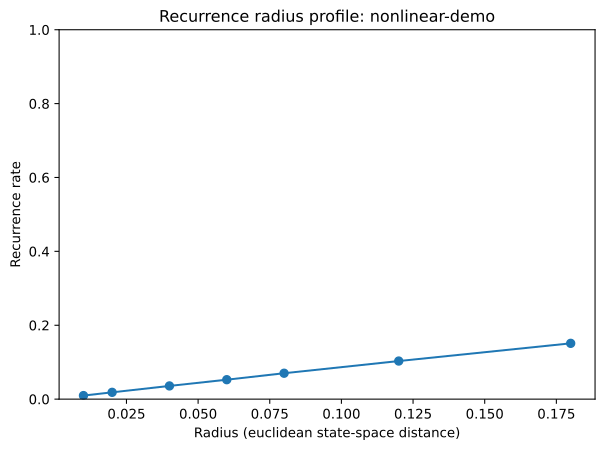
Exact RR(radius) diagnostics and pair-distance threshold sensitivity without automatic radius selection.
API:
recurrence_radius_profile(),plot_recurrence_rate_curve() -
Population uncertainty for RQA summaries
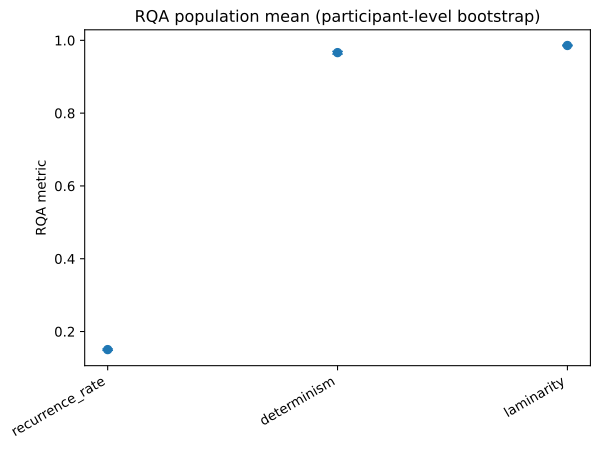
Percentile-bootstrap uncertainty for fixed-specification curve-level RQA metrics using equal-weight participant inference units.
API:
bootstrap_rqa_metric_means(),plot_rqa_metric_mean_bootstrap() -
Time-varying RQA
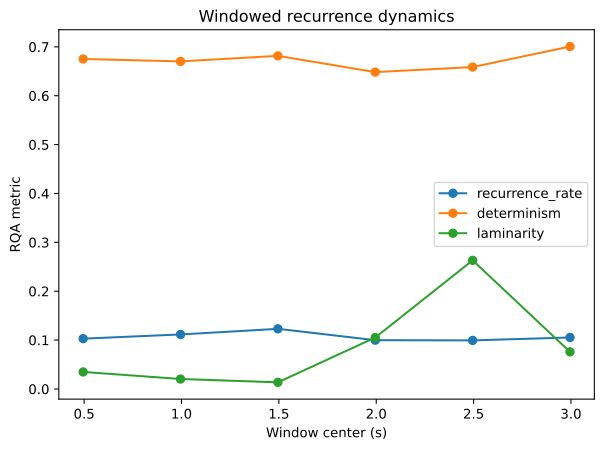
Full-window recurrence rate, determinism, and laminarity retained over trial time.
API:
windowed_rqa(),plot_windowed_rqa() -
RQA-derived functional trajectories
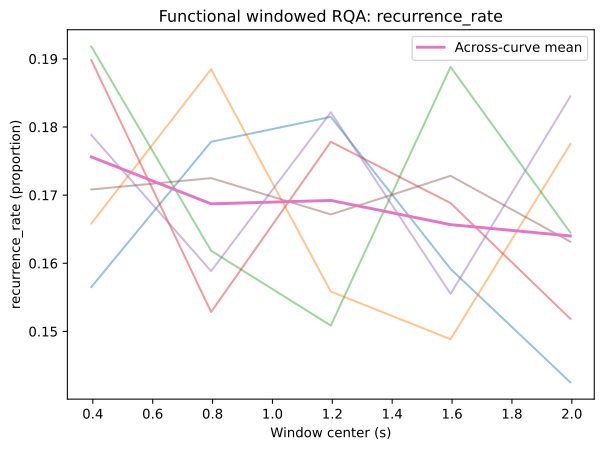
Sliding-window recurrence summaries promoted to a native functional representation while retaining overlap, edge/tail, and radius-policy provenance.
API:
windowed_rqa_trajectory_set(),plot_windowed_rqa_trajectories()Worked example · Mathematics - Local divergence / Rosenstein LLE
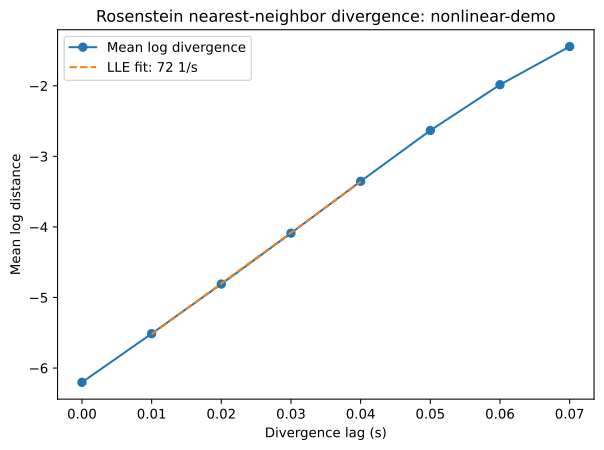
Mean nearest-neighbor log divergence and the explicitly declared linear fit interval.
API:
local_divergence_curve(),estimate_largest_lyapunov_rosenstein(),plot_local_divergence() -
Kantz neighborhood divergence
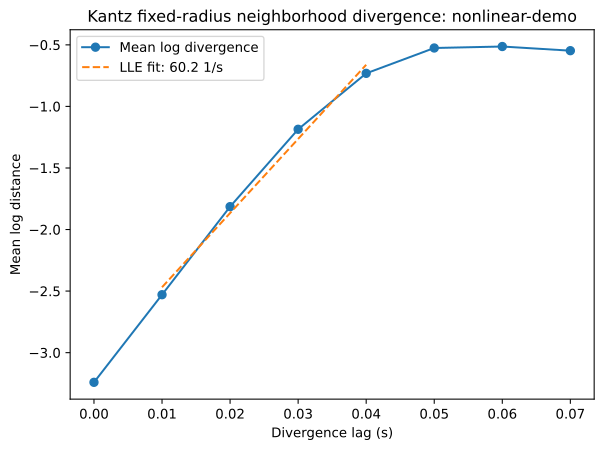
Fixed-radius local-neighborhood divergence with explicit minimum-neighbor support and analyst-declared fit interval.
API:
kantz_divergence_curve(),estimate_largest_lyapunov_kantz(),plot_local_divergence() -
Kantz radius sensitivity
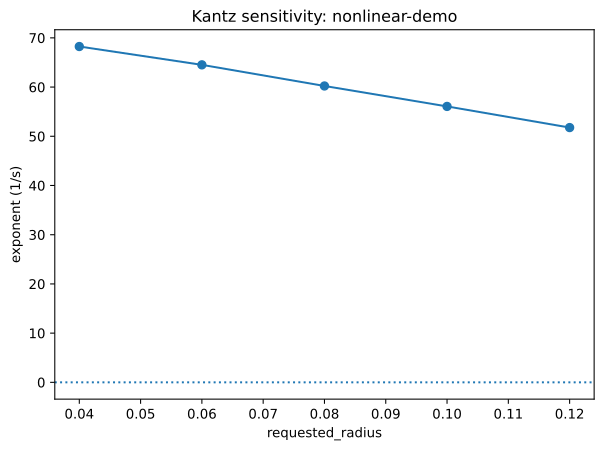
Exponent sensitivity over a predeclared fixed-radius grid with reconstruction, minimum-neighbor, Theiler, and fit settings held explicit.
API:
kantz_parameter_sensitivity(),plot_kantz_sensitivity() -
Experimental empirical return map
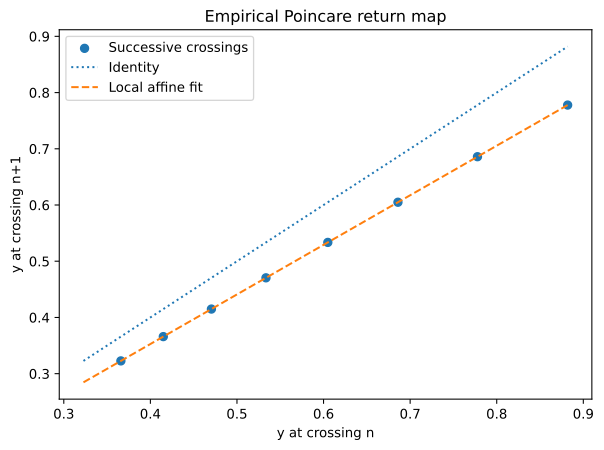
Successive section crossings and a local affine return map for a deterministic synthetic contracting cycle.
API:
poincare_crossings(),fit_local_return_map(),return_map_stability(),plot_poincare_return_map()
Reproduce the gallery
Run:
python scripts/generate_docs_gallery.py
The generator uses the package itself, fixed random seeds, the non-interactive Matplotlib backend, deterministic SVG hashing, and timestamp-free SVG metadata.
Plot → method → equation
plot_fpca_component() visualizes
plot_function_on_scalar_coefficients() visualizes an observed-grid coefficient function and, when a simultaneous-band result is supplied, the calibrated lower/upper band for the declared coefficient or coefficient family.
plot_functional_mean_band() visualizes
plot_fpca_wild_bootstrap_projection() visualizes
plot_dynamic_time_warping_alignment() visualizes the selected monotone index path. For symmetric2, the raw path cost uses step weights 2 for diagonal moves and 1 for horizontal/vertical moves; the optional normalized distance divides the complete global cost by \(N+M\).
plot_recurrence() visualizes sparse entries satisfying
$ R_{ij}=\mathbb I{|\mathbf z_i-\mathbf z_j|_p\le\varepsilon}. $
plot_local_divergence() visualizes
$ D(k)=\frac{1}{N_k}\sum_i\log d_i(k), $
with the analyst-declared LLE fit interval when an estimate is supplied.
plot_poincare_return_map() visualizes successive crossings under
$ \mathbf z_{n+1}\approx \mathbf a+\mathbf J(\mathbf z_n-\mathbf z_0). $
plot_fpca_wild_bootstrap_monte_carlo_diagnostics() visualizes the raw retained tail estimate and exact binomial precision limits, where
Gallery contract
The docs workflow regenerates all twenty-five assets before the strict MkDocs build and runs scripts/validate_docs_contracts.py. A missing image, stale generated equation index, broken nav target, undefined mathematical deep link, missing mathematical API contract, stale MathJax hook, or unresolved documented public symbol fails the documentation job.