How to read independently audited functional confidence-band experiments
Methods companion · 20 October 2026 · W3 numerical evidence series
The W3 eyetrajectoriespy research programme uses fully synthetic trajectories with a known generating slope to test simultaneous functional inference. The evidence is strongest when three separate questions are not confused: was the statistic computed correctly?, does the confidence procedure cover the generating function at its advertised rate?, and will the result transfer to real gaze data?
The audited R70–R75 failure analysis, R76 high-leverage replication experiment, R77 fixed covariance regularization experiment, and R78 temporal covariance stress test offer examples of why those questions require different evidence.
Research-only inference
These methodological descriptions do not authorize a new or existing W3 procedure as generally nominal-90% calibrated. The generating Gaussian covariance, exact generating slope and analytic variance ratios are known only within simulation, not from participant recordings. Version 1.2 remains on release HOLD; #289 and #296 remain open.
1. Define the correct source-level event
Suppose a functional regression fits the slope coefficient \(\beta_1(t,d)\) at 31 time positions and two coordinate dimensions. For each independent generated dataset, a nominal simultaneous band is successful only when the entire generating slope function lies within its band:
The simulation coverage estimate is the mean of these source-level binary indicators, not an average of 62 independent pointwise events. A procedure might achieve reasonable pointwise inclusion at many locations and still fail badly on the maximum-statistic event.
The correct independent simulation unit must also be identified. In R77 and R78, each fixed design/support/variance condition has 32 independent generating blocks. The 256 source-condition cases across the factorial are not 256 independent replications of each condition. In the repeated-trial design, 36 participants—not 108 trials—are the independent observational units inside one source.
2. Keep simulation blocks separate from reference draws
R78 archives exactly 999 conditional maximum-statistic reference draws per candidate and source. Those 999 values approximate one source's critical value. They are not 999 additional independent scientific datasets.
A nominal 90% band for each source uses a reference critical value obtained by the fixed higher empirical 90th-percentile rule, then tests inclusion of the known slope at all 62 coordinates.
Consequently, the observed R78 two-anchor heteroskedastic curve count 22/32 for frozen λ=.50 is 68.75% inclusion over 32 independently generated datasets, not 22 successes among 999 bootstrap draws and not 90% merely because the reference quantile was the 90th percentile. With n=32, uncertainty around a reported source coverage frequency remains substantial; even 29/32 does not establish general calibration across other designs.
3. Distinguish numerical reconstruction from statistical validity
The independent original-archive audit verifies that two separate implementations agree on the same source inputs, formulas, raw maxima and truth classifications. It guards against mismatched source identities, source-level exclusions, array reshaping errors, incorrect critical quantiles and mistaken inferential denominators.
For R78, the independent implementation reconstructed: - 256 original new Gaussian X/Y source datasets and the true scaled-AR(1) covariance mechanism; - Five independently rebuilt sets of 999 maximum-statistic reference values per accepted source, or 1,278,720 individual numbers; - Source-level 31 × 2 maximum slope errors, true and estimated marginal SE, fixed covariance regularization and whole-band truth-inclusion events; - Immutable SHA256 and source-checkout identities; zero refused source cases in the original audit.
The original R78 scientific run passed 12/12 scientific jobs and the independent R78-A run passed 4/4. Those are reproducibility claims. Neither numerical agreement nor green CI upgrades an estimated confidence-band method to a generally valid statistical procedure.
4. Interpret changes to marginal scale and the joint maximum together
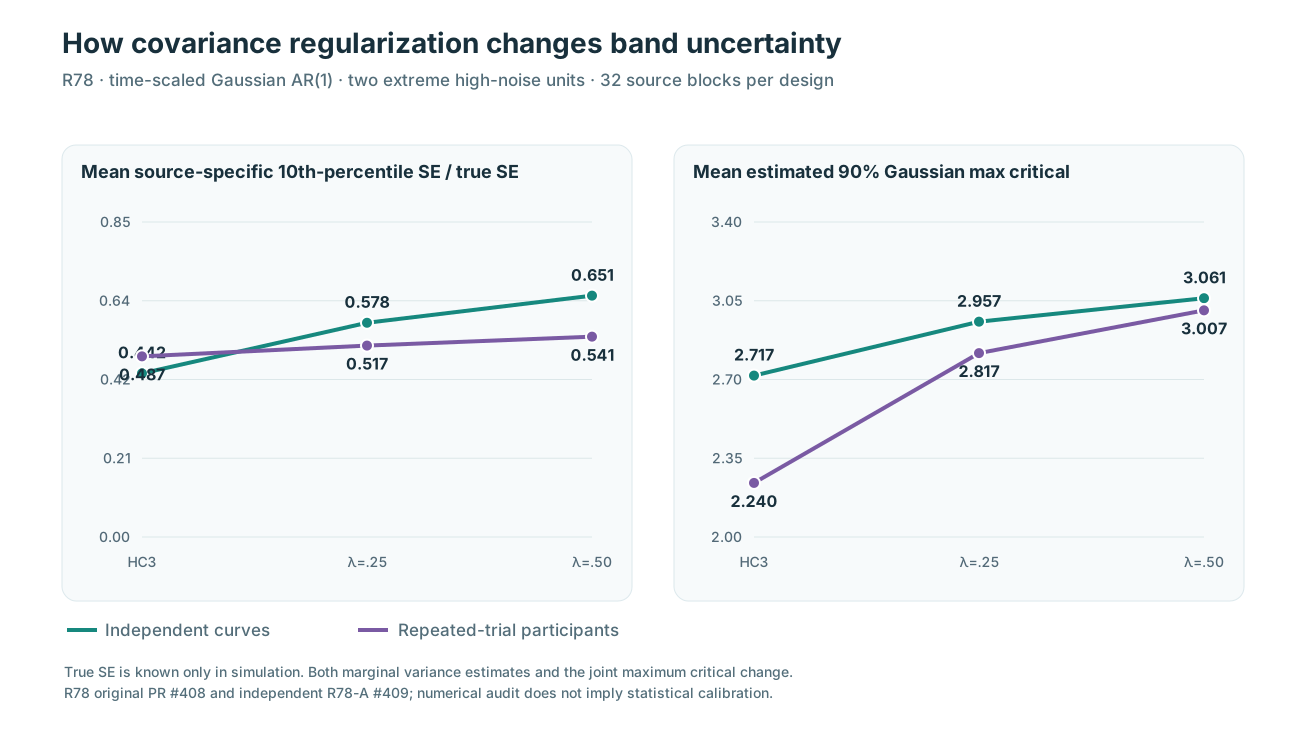
Figure 1. Under R78's two-anchor predictor-dependent Gaussian noise scenario, data-estimated regularization changes both lower-tail marginal SE ratios and the Gaussian simultaneous critical. All source-known values in this figure are diagnostics requiring simulation truth.
A simultaneously calculated band inherits two different uncertainties: its fitted marginal SE function and its estimated joint maximum-statistic reference, which depends on covariance across functional coordinates.
When λ changes, the R78 candidate changes the estimated covariance's diagonal and its correlation structure. A higher reference critical can increase inclusion by widening the entire band even if the marginal scale remains underestimated at some coordinates. A larger empirical coverage count is not, alone, evidence that the estimated covariance model has become structurally accurate.
The generating-law Gaussian comparator helps diagnose this problem precisely because it uses the stipulated source covariance. It is an oracle benchmark for a controlled experiment, not a feasible real-data correction.
5. Compare experiments without falsely pairing them
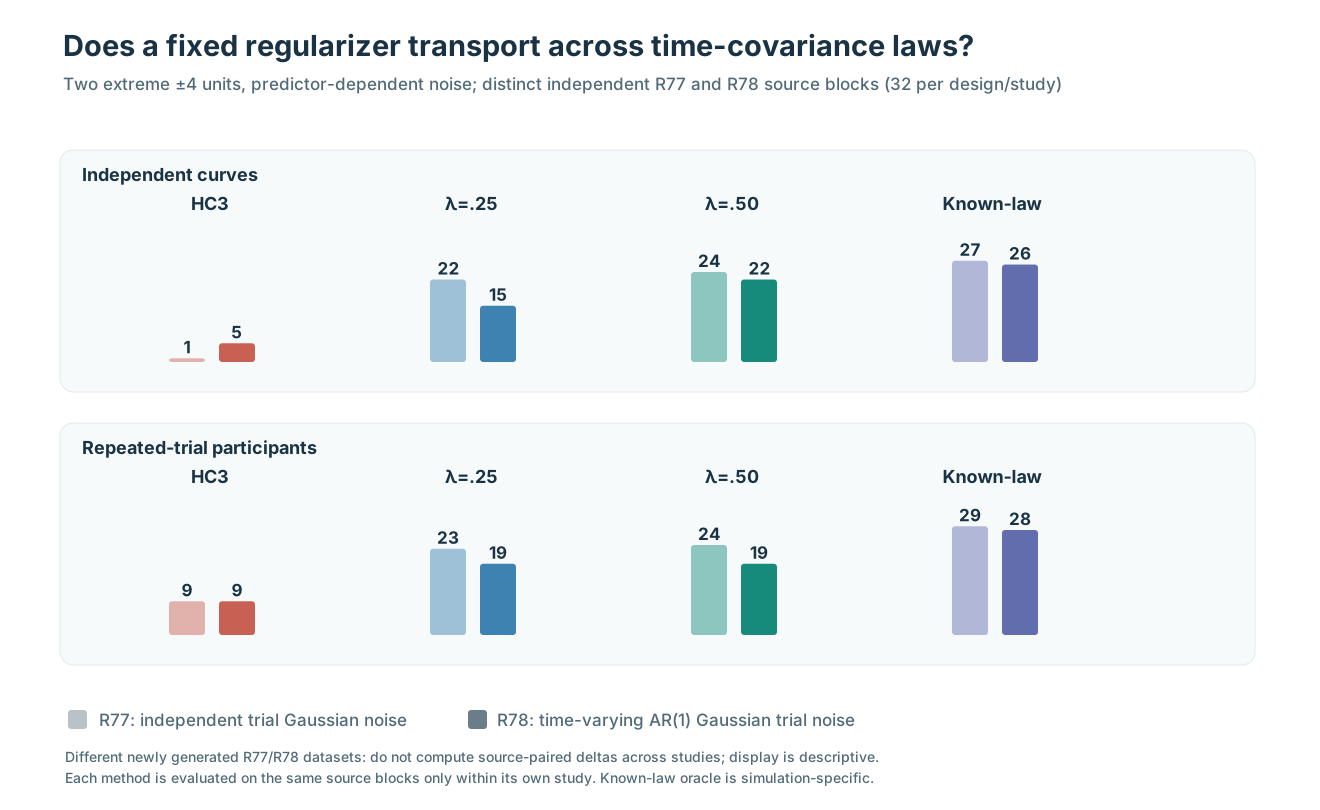
Figure 2. R77 and R78 share two fixed regularization strengths and similar high-leverage experimental cells, but use separately generated source blocks. These comparisons are descriptive cross-study contrasts, not paired changes within the same generating datasets.
For example, frozen λ=.25 under two extreme high-noise predictors gives 22/32 curve-source truth inclusions in R77 and 15/32 in R78. Their generating covariance laws differ, but so do the primitive simulation sources. It would therefore be inaccurate to present the seven-count difference as a directly observed source-paired causal effect of temporal correlation.
Within one R78 source condition, however, all methods are applied to the same generated data. Those source-level inclusion indicators support a meaningful method-versus-method paired discordance analysis, which the independent audit verifies. A full calibration claim would nevertheless require stronger source replication and substantially broader generating laws.
6. Publish unfavorable results and limitations alongside attractive plots
A defensible W3 scientific dashboard should always show the number of attempted sources, complete/refused cases, the true independent unit, the nominal confidence level, the band scope, the generating covariance family, the exact candidate specification and the source-known benchmark. Both undercoverage and overcoverage are relevant. A method that returns extremely wide bands can report high truth-inclusion frequency while remaining practically uninformative.
The R78 full-grid inclusion figure shows why the full results matter: the fixed λ=.50 method includes the generating slope in 22/32 independent curve sources and 19/32 participant sources under the adverse two-anchor heteroskedastic condition, despite better results in the 16-anchor comparator and some constant-variance cells.
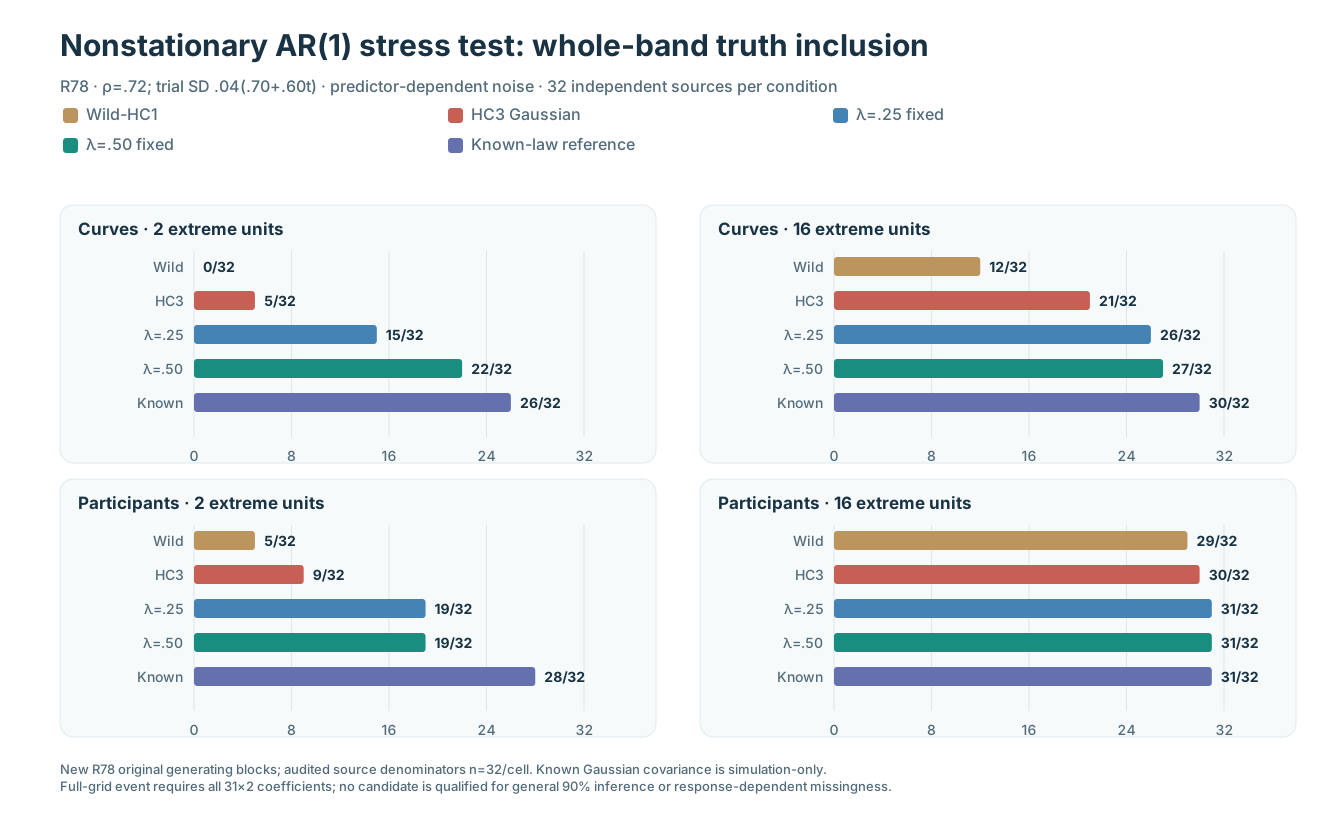
Those values are not release thresholds. No version of the published W3 research has demonstrated reliable nominal-90% simultaneous coverage over genuinely irregular, missing, non-Gaussian or nonstationary observed eye-tracking processes. The response-dependent loss problem in issue #296 remains separate and unresolved.
Evidence and further reading
The underlying original scientific methods are retained in draft branches, while the public documentation keeps the research findings and original SVG figures separate from the stable package API. Start with the R78 temporal covariance article for the source experiment, the R77 fixed-regularization article for its direct predecessor, and the original figure gallery for additional research evidence.
Scientific next gate: tests with independent fresh sources under more flexible temporal/cross-coordinate covariance, genuine heavy-tailed errors and response-dependent observation loss—plus a fail-closed estimator that does not exploit unavailable generating-law parameters. Until then, the release boundary remains unchanged.