Can outcome-dependent gaze loss be corrected without identifying the observation model?
Scientific research article · 21 October 2026 · original R83 and independent R83-A numerical audit
Pointwise assumption sensitivity, not an identified MNAR correction
R83 evaluates hypothetical inverse-observation-probability weighting on fully synthetic sources, using different assumed relationships between observed outcome residual and gaze loss. The MNAR selection coefficient is not identified from observed data. No supported missing-data estimator, valid covariance estimate, confidence interval, or nominal-90% simultaneous band is introduced. Source implementations remain draft R83 PR #423 and independently implemented R83-A audit PR #424. Stable eyetrajectoriespy 1.1.0 still refuses missing trajectories, and unreleased version 1.2 remains on HOLD.
Background: estimability is not identifiability
The R82 observation-process falsification established that substantial sample retention can coexist with extensive refusal of individual functional slope positions if independent high-leverage predictor units are lost. That result separates a missingness problem from Gaussian covariance or heavy-tail problems addressed in R79–R81. Yet even when a grid position can be fitted, a further question remains: can the dependence of observation on its missing outcome be learned from the observed data?
Not in general without additional identifying assumptions or external information. Under missing not at random (MNAR), the probability of gaze observation can depend on the true gaze value even when that value is subsequently lost. The available observations alone do not generally identify this dependence. R83 therefore freezes a sensitivity family of hypothesized selection coefficients, rather than claiming to estimate the true missing-data mechanism.
Prospective generating design and four observation masks
The R83 source protocol was committed before outcomes. 32 genuinely new independent primitive generating blocks were evaluated under two independent-unit configurations—72 independent curves or 36 participants each with three trials—two signed extreme-predictor supports (2 or 16 x=±4 independent units) and constant or predictor-dependent unit variance.
There are 256 complete synthetic source-condition datasets, each receiving four paired observation masks: COMPLETE, MCAR, MAR and MNAR. The generating source retains a common 31-time × 2-coordinate slope truth; nonseparable time/coordinate Gaussian innovations; a shared Student-t5 independent-unit radial multiplier; and a centered, rare asymmetric unit shock. MCAR has missing probability .12; MAR depends on recorded predictor magnitude, time and trial; MNAR adds simulator-known outcome dependence to the MAR selection logit:
The source-known coefficient +1.1 and true conditional generating mean are available only to the simulator. The four masks are paired within each source, not four new independent generating sources. In total: 1,024 original mask evaluations, with 32 independent generating blocks per fixed cell.
Five hypothetical selection models using only visible outcomes
The principal question uses the same actual observed mask but varies a hypothetical selection parameter. At each time and coordinate, an initial unweighted pilot intercept and slope are estimated from visible trial-level responses only. For each retained sample, R83 forms a candidate observation probability
Five values were frozen prospectively:
The resulting pointwise weighted least-squares diagnostic uses inverse assumed observation probability \(1/\pi_\delta\) for visible trials. Three trials from the same participant remain one independent participant cluster; no variance estimator, standard error or confidence band is computed. Individual grid positions are refused if there are fewer than eight distinct independent units, not both signed x=±4 anchors, a rank-deficient design, or assumed observation probability below .02.
An additional MCAR known-probability diagnostic and unmasked complete-source OLS serve as comparisons. A fifth MNAR source-reference case uses the simulator-known true mean and true selection coefficient +1.1 to calculate the true-source oracle propensity. This is deliberately labeled infeasible in observed gaze data. Even that oracle need not minimize finite-source absolute estimation error or produce valid confidence bands.
Each complete source yields 13 analysis configurations: complete ×1, MCAR ×1, MAR δ sensitivity ×5, MNAR δ sensitivity ×5, and source-known oracle ×1. Accordingly, 3,328 analysis records are archived from 256 true X/Y conditions, not 3,328 independent experiments.
Empirical sensitivity: the same observed MNAR mask supports different weighted slopes
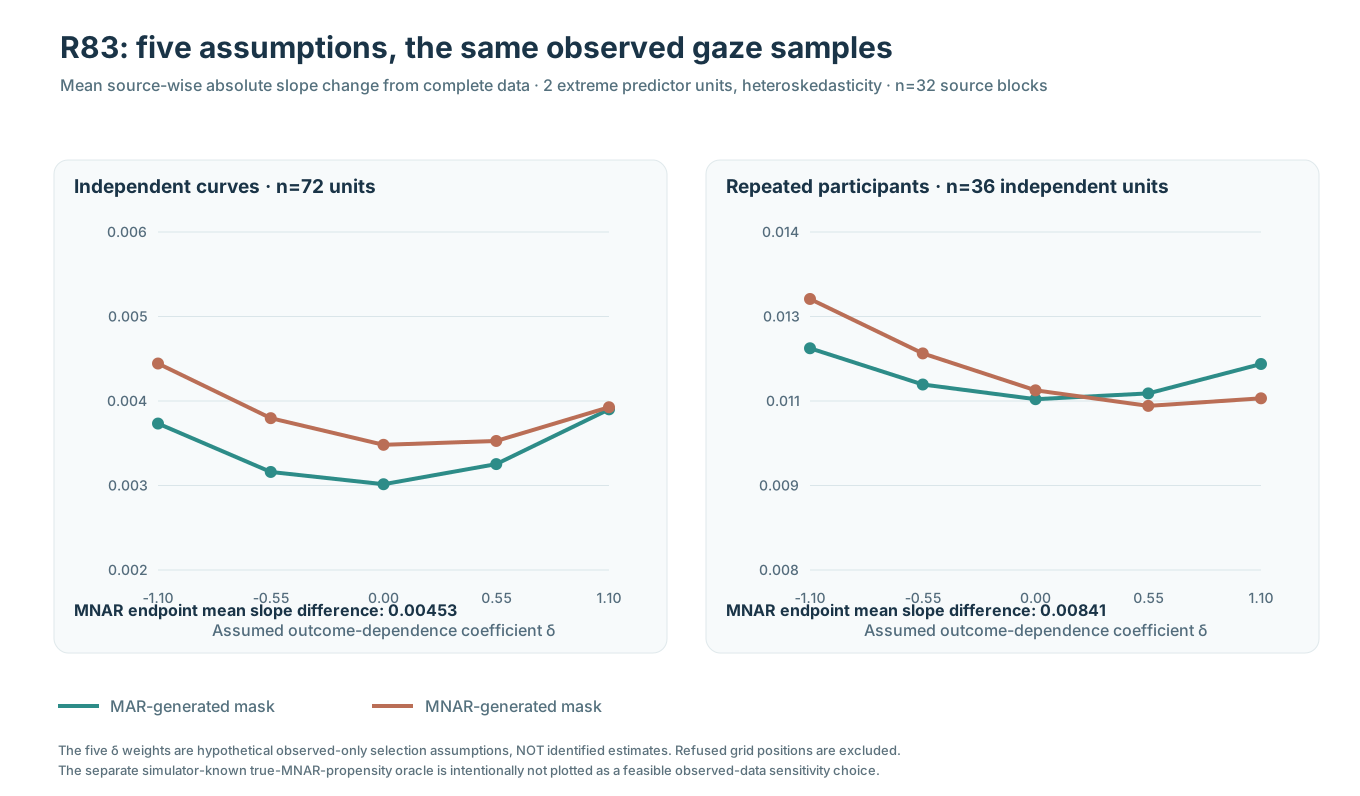
Figure 1. Source-average mean absolute difference between the hypothesis-weighted pointwise slope and the same source's complete-data slope. The predictor-dependent two-anchor adverse design is shown. Every point for a given mechanism is fitted to the same observed samples; δ is changed as an assumption only. The MAR and MNAR masks are different, and each average is restricted to its estimable grid points.
| Assumed δ | Curves, MNAR mask | Participants, MNAR mask |
|---|---|---|
| −1.10 | .004444 | .012811 |
| −0.55 | .003797 | .011845 |
| 0 | .003481 | .011190 |
| +0.55 | .003527 | .010913 |
| +1.10 | .003926 | .011048 |
The source-mean absolute endpoint difference in the fitted slope itself, comparing δ = −1.10 against +1.10 at grid positions estimable under both assumptions, is .004530 for independent curves and .008409 for repeated-participant units. This endpoint difference is not the same quantity as subtracting the displayed mean absolute errors: slope differences can have different signs across time and coordinate.
This sensitivity variation is scientifically meaningful but does not reveal which δ is correct. All five are observational assumptions. The δ=0 model is equivalent to the MAR-style assumed selection propensity, not evidence that gaze loss is actually MAR.
Retention and independent source support remain unresolved by weighting
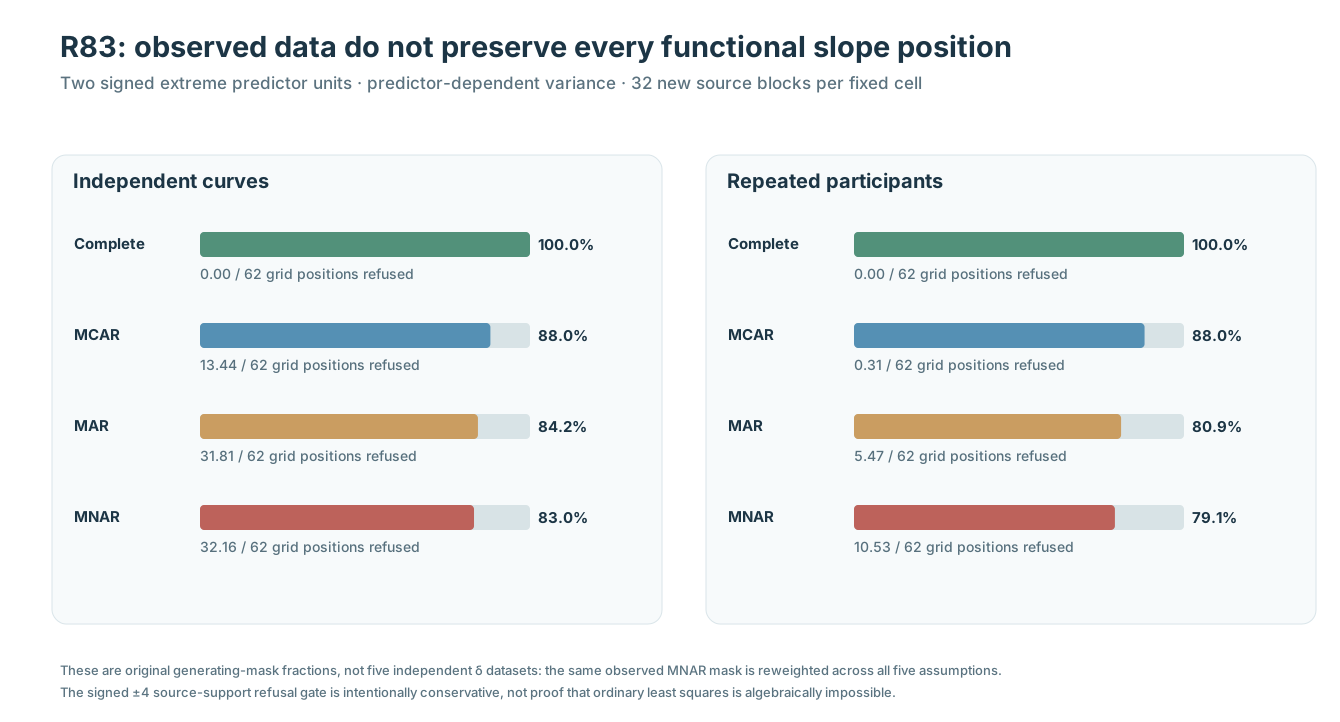
Figure 2. Two signed extreme predictor units and predictor-dependent source variance. Observation fractions and refused grid positions are properties of the original masks and support gate, not extra δ-dependent independent datasets.
| Source mechanism | Curves: observed % | Curves: refused /62 | Participants: observed % | Participants: refused /62 |
|---|---|---|---|---|
| COMPLETE | 100.0 | 0.00 | 100.0 | 0.00 |
| MCAR | 88.0 | 13.44 | 88.1 | 0.31 |
| MAR | 84.2 | 31.81 | 80.9 | 5.47 |
| MNAR | 83.0 | 32.16 | 79.1 | 10.53 |
Inverse-propensity weighting cannot create the missing negative or positive influential predictor unit when a grid position fails the signed-anchor gate. The observed-only sensitivity analysis deliberately refuses that position, rather than manufacturing an estimated slope and propagating it into a full-function confidence band.
This is a conservative, prespecified support rule, not a proof that ordinary least squares is algebraically impossible without both extreme signed anchors. The reported sample retention percentages also do not establish positivity of the actual unobserved selection mechanism.
Selection weights and independent-unit information
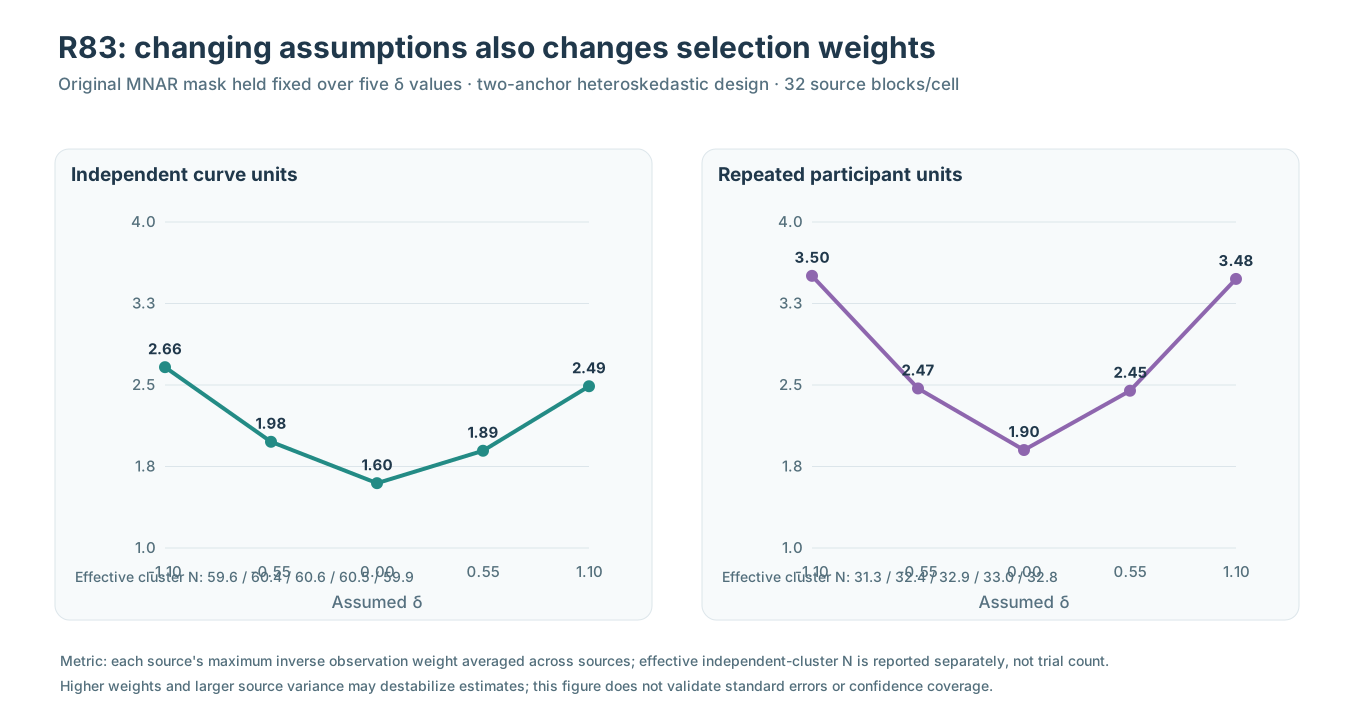
Figure 3. With the original MNAR mask fixed, changing δ changes the assumed observation probabilities, maximum weights and effective independent-cluster sample sizes. The effective-n diagnostic is cluster-based, not the number of observed repeated trials.
Under the primary adverse MNAR condition, source-mean maximum inverse weights for curves range from approximately 1.60 at δ=0 to 2.66 at δ=−1.10, while effective independent cluster N varies roughly 59.6–60.6 out of 72. For participants, mean maximum weights range from approximately 1.90 to 3.50; effective cluster N ranges roughly 31.3–33.0 out of 36. None of these descriptive diagnostics supplies an uncertainty estimator or validates the chosen selection model.
Why the simulation-only oracle does not settle MNAR
In the same adverse MNAR source, the source-known true-propensity oracle's mean absolute shift from its complete-data slope was approximately .004475 for curves and .011453 for participants. Those values are not necessarily smaller than the sensitivity versions based on an estimated visible-outcome mean, and this does not disprove the generating oracle: the estimands, selected grid, stochastic weighting and finite-source realization matter. The oracle specifies the original selection probability, not a guaranteed minimum finite-sample absolute error algorithm.
Most importantly, real sensor recordings do not reveal the true generating mean at missing gaze positions or the actual outcome-dependent δ. Reporting an oracle computed from these simulator-known variables as a deployable MNAR correction would be scientifically invalid.
Independent original-source numerical verification
Original R83 workflow #39575847765 passed 12/12 dedicated jobs, with original SHA256 archive #12333573581 pinned to scientific checkout 4aaf792457c789b3fafd218e3dd94ae46af47e86.
The independently coded R83-A original-source audit #39576738539 passed 4/4 dedicated jobs and retained its separate audit artifact #12334118238. It independently regenerated 256 original X/Y sources, 1,024 paired observation masks and all 3,328 assumption-weighted pointwise/oracle records, including the visible-only pilot, numerical weighted regression, signed support refusal, cluster effective N, source truth/complete contrasts and original SHA256 identities.
These checks establish reproducibility of this stipulated synthetic observational sensitivity design, not identification of an outcome-dependent missingness law, general external validity, or calibrated 90% coverage.
Interpretation and next methodological decision
R83 makes the central inferential gap more explicit: different scientifically plausible assumptions about gaze-dependent observation can produce different pointwise slopes from the same recorded samples. The missing selection dependence is not learned merely by fitting observed responses. Even a coherent source-known weighting reference does not solve uncertainty propagation or full-grid support failure.
Future inference would require an explicit estimand and identifying data or defensible sensitivity region, positivity diagnostics, participant-cluster uncertainty, partially observed continuous-time modeling, and source-independent coverage assessment under a range of misspecified selection models. None is supplied by R83.
Release decision unchanged: W3 scientific issues #289 and #296 remain open. Experimental code stays in research draft PRs, stable 1.1.0 and protected-main inference API remain unchanged, and eyetrajectoriespy 1.2/PyPI publication remains on RELEASE HOLD.
Methods companion · Original numerical source and figure ledger