W3 simultaneous-band calibration: audited evidence and original plots
Evidence gallery · updated 20 October 2026 · synthetic Gaussian simulations only
What these figures do not establish
The public stable distribution remains 1.1.0. The plots summarize original simulated source outcomes and independent numerical audits from unmerged draft research PRs, not studies on original human-subject eye-tracking recordings. No W3 whole-function confidence band is qualified as generally nominal-90% in this programme. Blocking issues #289 and #296 remain open. Figures do not alter the package API or authorize a PyPI release.
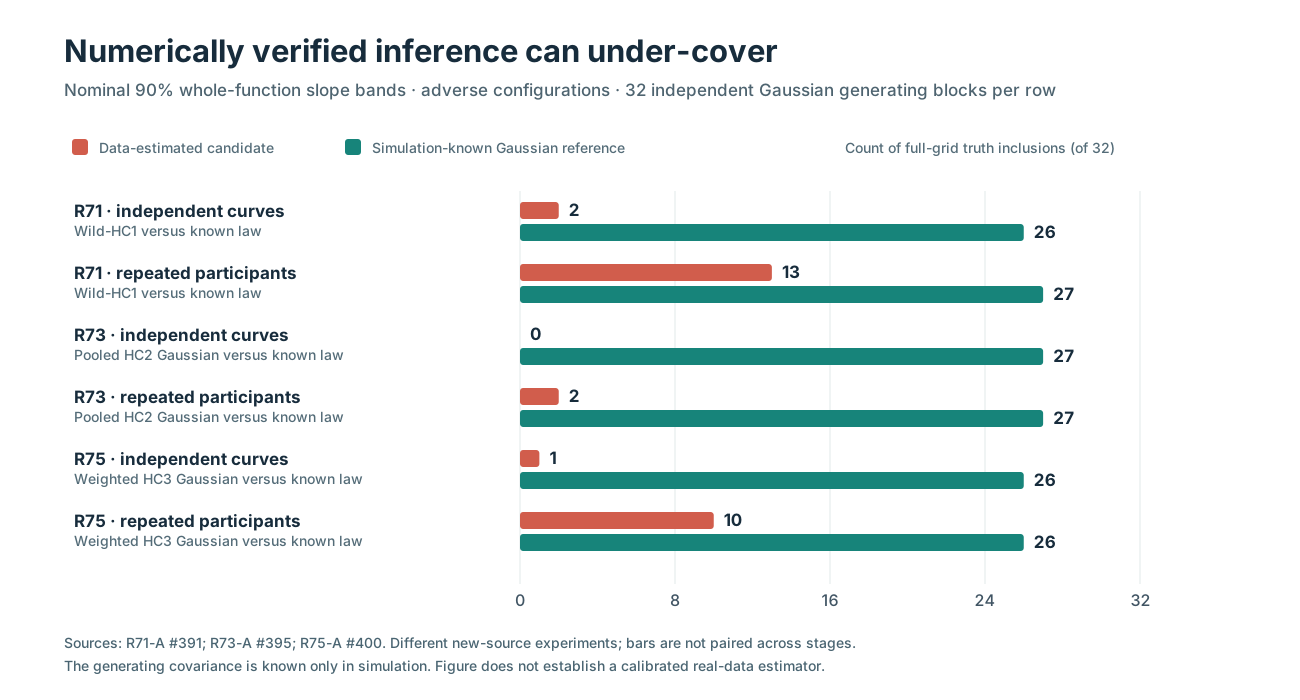
Figure 1 — R71/R73/R75: estimated procedures compared with generating-law references
Read the scientific article: when numerically correct simultaneous bands under-cover.
This is a cross-study descriptive display, not a paired estimator comparison across R71, R73 and R75. Each reported cell has 32 independent generating source blocks; different stages generated different synthetic datasets, covariance regimes and/or estimated procedures.
| Original + independent audit | Original scientific source workflow | Total completed source cases | Figure 1 tested conditions and 90% inclusion counts |
|---|---|---|---|
| R71 / R71-A #391 | R71 #390 | 128/128, 0 refusals | Extreme leverage: curves wild-HC1 2/32, known Gaussian 26/32; repeated participants 13/32 versus 27/32 |
| R73 / R73-A #395 | R73 #394 | 256/256, 0 refusals | Extreme leverage + predictor-dependent variance: pooled HC2 Gaussian curves 0/32, known heterogeneous Gaussian 27/32; participants 2/32 versus 27/32 |
| R75 / R75-A #400 | R75 #399 | 256/256, 0 refusals | Extreme leverage + predictor-dependent variance: HC3 estimated SE/HC3 correlation curves 1/32, known law 26/32; participants 10/32 versus 26/32 |
All figure bars use truth-inclusion counts out of 32, not bootstrap draws or percentages silently substituted for counts. The generating Gaussian covariance is known only to the simulation. R71's extreme curve comparison, for example, is 2 vs 26 successes on different candidate/oracle methods applied to the same 32 original datasets, whereas R71 and R73 did not reuse source datasets.
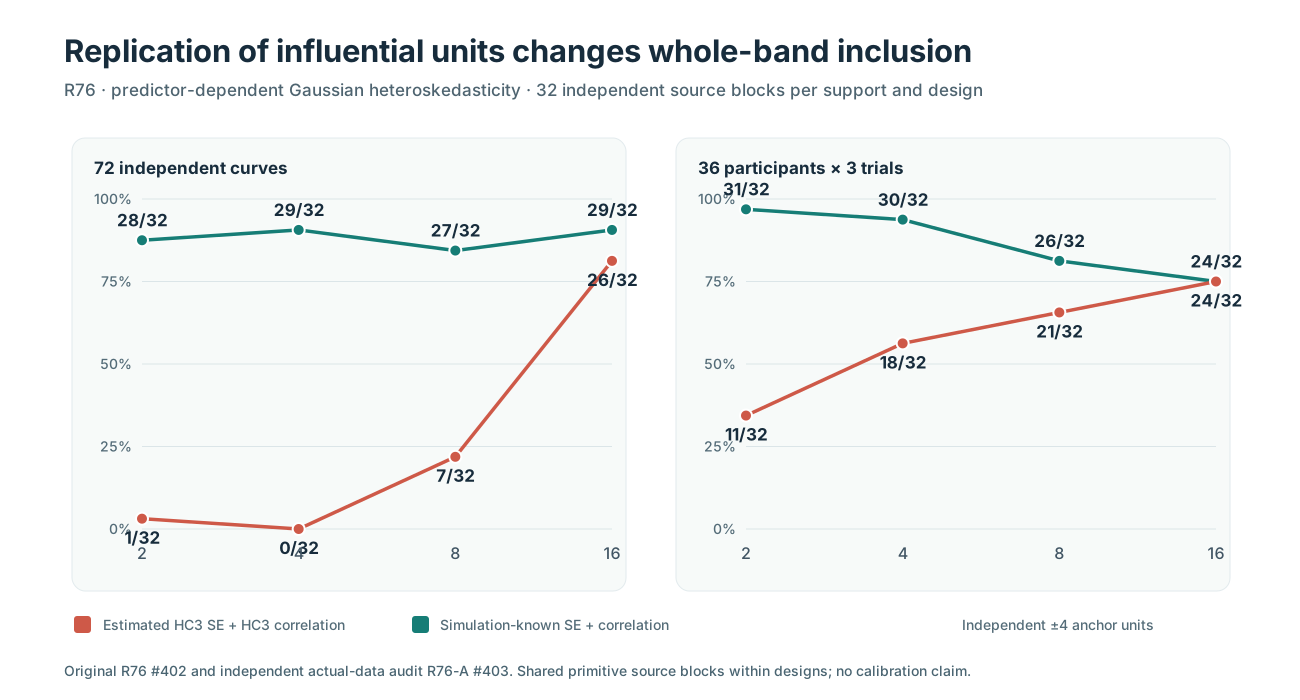
Figure 2 — R76: whole-function truth inclusion by replicated extreme support
Read the scientific article: how independent leverage support affects coverage.
The independent predictor extremes x=±4 are 2, 4, 8 and 16 separately simulated independent units, evenly balanced by sign; other predictors lie in Uniform(−0.95,0.95). The adverse covariance regime scales unit SD by \(1+0.75|x_i|\). This is 32 independent generating source blocks for every design/support/variance condition; the 512 complete cases across all conditions share paired source blocks.
| x=±4 independent anchors | Curves: estimated HC3 SE + HC3 corr | Curves: known Gaussian | Participants: estimated HC3 SE + HC3 corr | Participants: known Gaussian |
|---|---|---|---|---|
| 2 | 1/32 | 28/32 | 11/32 | 31/32 |
| 4 | 0/32 | 29/32 | 18/32 | 30/32 |
| 8 | 7/32 | 27/32 | 21/32 | 26/32 |
| 16 | 26/32 | 29/32 | 24/32 | 24/32 |
Figure 3 — R76: why source-wise SE diagnostics matter
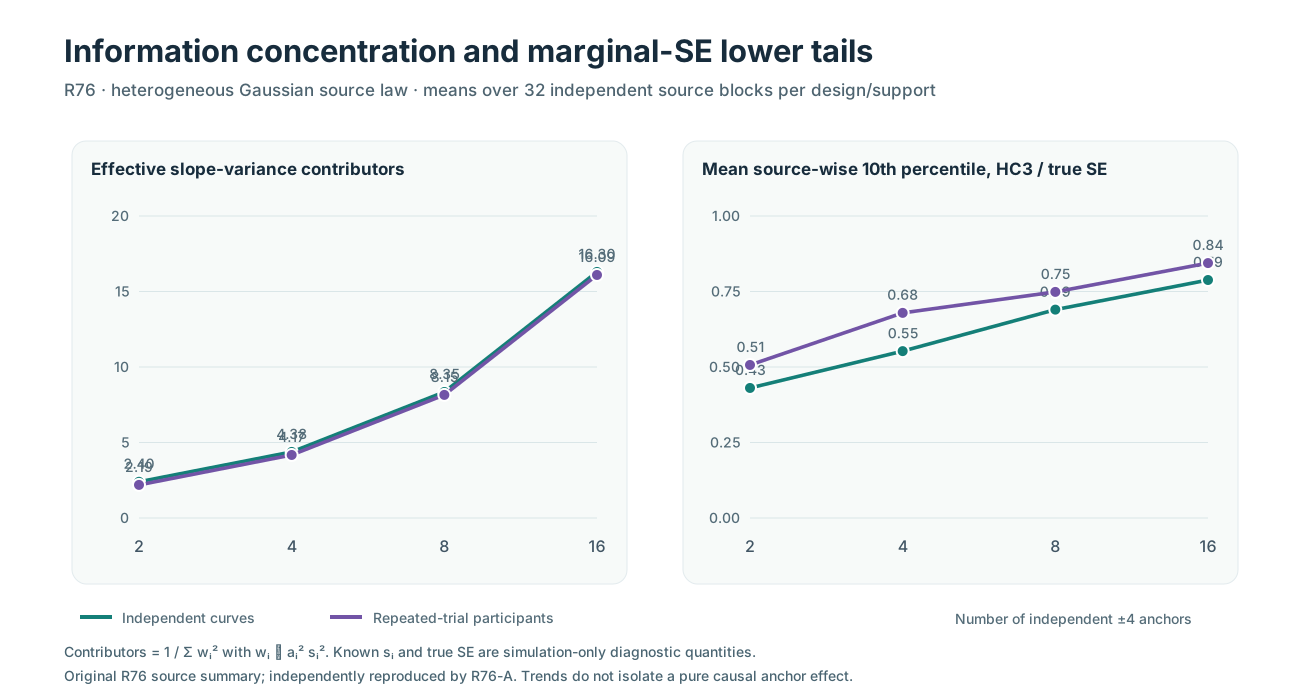
The first panel plots the generating-law variance concentration index \(N_{\mathrm{eff,var}}=1/\sum_i w_i^2\), where \(w_i\propto a_i^2s_i^2\). The second plots the mean across 32 source datasets of each dataset's 10th percentile across 62 slope coordinates of \(\widehat{\mathrm{SE}}_{HC3}/\mathrm{SE}_{true}\). Both require simulation-known variance or SE, and neither is a validated plug-in diagnostic for real gaze data.
| Independent anchors | Curves \(N_{eff,var}\) | Participants \(N_{eff,var}\) | Curves HC3/true SE lower-tail | Participants HC3/true SE lower-tail |
|---|---|---|---|---|
| 2 | 2.398 | 2.192 | 0.431 | 0.507 |
| 4 | 4.376 | 4.174 | 0.553 | 0.679 |
| 8 | 8.347 | 8.152 | 0.690 | 0.749 |
| 16 | 16.297 | 16.095 | 0.788 | 0.844 |
Increasing the number of independently contributing high-leverage units cochanges regression support, slope precision and source information weights. The observed improvements support a finite-sample information-concentration mechanism in this experimental law, but do not isolate a pure causal effect or define a universal minimum effective sample size.
R76 reproducibility and audit ledger
| Evidence identity | Verified result |
|---|---|
| Original prospective source protocol | R76 draft PR #402, research-only |
| Original science workflow | #39397281090, 12/12 science jobs passed |
| Original immutable evidence | Artifact #12252397295 |
| Independently implemented numerical audit | R76-A draft PR #403 |
| Independent mandatory source audit workflow | #39397981410, 4/4 science audit jobs passed |
| Independent archived report | Artifact #12253250987 |
| Frozen original scientific source checkout | 47bea211279aec9bf547c5239a20976058a7a4a3 |
| Attempted original source cases | 512; 512 complete, 0 refused |
| True independent replication unit | 32 generating source blocks per specific design/support/variance cell |
| Audited maximum-statistic values | 511,488 W3 wild + 511,488 known-correlation Gaussian + 511,488 estimated-HC3-correlation Gaussian = 1,534,464 values |
| Immutable archive verification | Three SHA256 members plus original source checkout verified |
| Production, inference and missingness qualification | Not authorized; #289 and #296 OPEN |
The plot artwork is a vector re-expression of the independently verified numerical evidence displayed in the tables above, not a new experiment, an independent replication or a plot of raw human eye-tracking recordings. The SVG files are checked into the documentation tree with the source-count ledger; any changes to the plotted scientific counts require checking against the separately retained source artifacts and independent audit report.
Reading order: Why simultaneous bands under-cover → R76 high-leverage replication → Scientific evidence dashboard. Original methodology remains in the research PRs; website publication is not research-code integration or product release.