Plotting reference
eyeprocesspy exposes a broad Matplotlib plotting surface across core eye-tracking, pupil/biometric streams, process quality, psychometrics/IRT, validation, governance, and advanced model families.
Most plotting helpers return a Matplotlib Axes object. Core plotting functions also attach their underlying plotted data to ax.eyeprocess_plot_data; matrix-like displays can additionally attach ax.eyeprocess_plot_matrix.
Basic pattern
import eyeprocesspy as ep

ax = ep.plot_eye_trace(eye, trial_id="T1")
ax.figure.tight_layout()
ax.figure.savefig("gaze-trace.svg", bbox_inches="tight")
Because the result is an ordinary Matplotlib axis, normal Matplotlib methods remain available for labels, titles, annotations, sizing, export, and multi-panel composition.
Core eye-tracking plots
| Function | Primary use |
|---|---|
plot_eye_overview() |
Canonical dataset component counts |
plot_eye_trace() |
Ordered gaze path |
plot_fixations() |
Fixation centroids and duration-scaled markers |
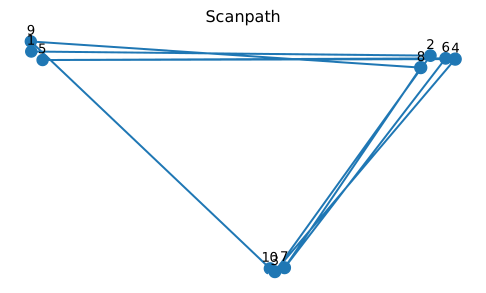
plot_scanpath() |
Ordered AOI visits/fixations |
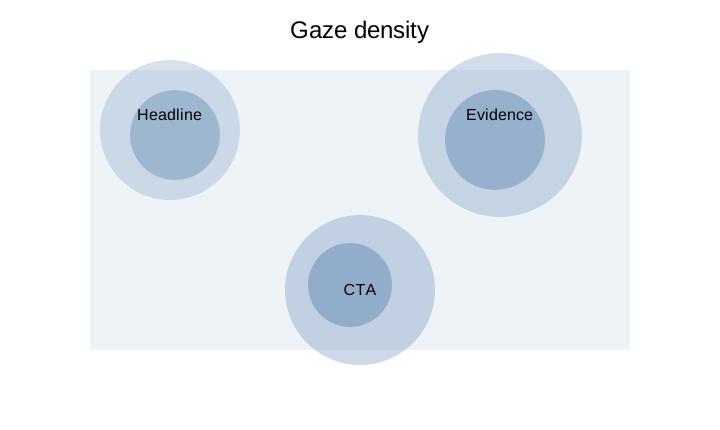
plot_gaze_heatmap() |
2-D gaze-density histogram |
plot_aoi_dwell() |
AOI dwell summaries |
plot_transition_matrix() |
AOI transition structure |
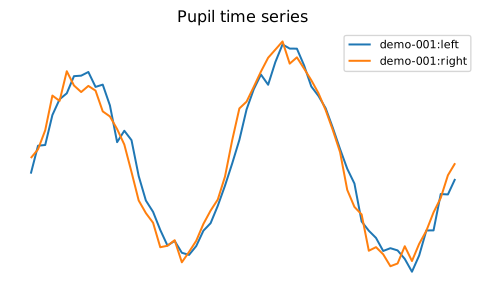
plot_pupil_timeseries() |
Pupil observations over time |
plot_biometrics() |
Biometric channels on a shared time axis |
plot_signal_quality() |
Signal-quality metrics |
plot_sampling_rate() |
Empirical/effective gaze sampling rate |
plot_clock_alignment() |
Clock/timebase diagnostics |
plot_coordinate_spaces() |
Coordinate-space diagnostics |
plot_missingness() |
Missing-data summaries |
plot_trial_timeline() |
Trial/event timing |
plot_feature_distribution() |
Derived feature distributions |
plot_feature_correlation() |
Feature relationship matrix |
plot_item_difficulty() |
Item-difficulty summaries |
plot_model_diagnostics() |
Model diagnostic surface |
Spatial examples
Pupil example
Process-quality plots
| Function | Use |
|---|---|
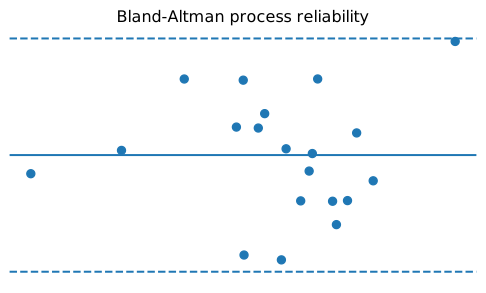
plot_eye_process_reliability_profile() |
Reliability/Bland–Altman evidence |
plot_eye_calibration_error_model() |
Empirical calibration-error cloud |
plot_eye_calibration_drift_profile() |
Calibration drift across sessions/groups |
plot_eye_data_quality_profile() |
Quality metrics across units |
plot_eye_probabilistic_aoi_assignment() |
AOI membership probabilities |
plot_eye_sampling_irregularity_audit() |
Timestamp irregularity diagnostics |
profile = ep.process_reliability_profile(
    repeated,
    person="person",
    session="session",
    measure="dwell_score",
)
ax = ep.plot_eye_process_reliability_profile(profile)
IRT and psychometric plots
The IRT surface includes explicit plot functions instead of relying on R-style S3 dispatch.
Representative functions include:
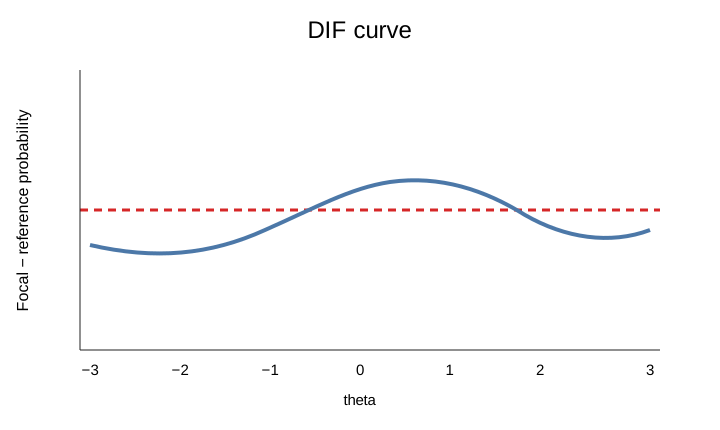
plot_eye_irt_information_profile();plot_eye_irt_test_characteristic_curve();plot_eye_irt_identification_audit();plot_eye_irt_sparse_design_audit();plot_eye_irt_q3_matrix();plot_eye_irt_item_fit();plot_eye_irt_person_fit();plot_eye_irt_fit_dashboard();plot_eye_irt_score_uncertainty();plot_eye_irt_adaptive_trace();plot_eye_irt_link_stability();plot_eye_irt_dif_curve();plot_eye_irt_dtf_curve();plot_eye_irt_process_alignment();plot_eye_irt_recovery_result();plot_eye_irt_sbc_evidence();plot_eye_cdm_qmatrix_audit();plot_eye_irt_bank_coverage();plot_eye_irt_targeting_gap();plot_eye_irt_missing_design_audit();plot_eye_irt_prior_sensitivity().
Access the plotted data
For core plots:
ax = ep.plot_transition_matrix(eye)
plotted = ax.eyeprocess_plot_data
matrix = ax.eyeprocess_plot_matrix
This allows a figure to remain auditable: the visual output and the exact data used to draw it can be retained together.
Reuse an existing axis
import matplotlib.pyplot as plt

fig, ax = plt.subplots(figsize=(8, 5))
ep.plot_eye_trace(eye, trial_id="T1", ax=ax)
fig.tight_layout()
Passing an axis is useful for manuscript panels and custom figure layouts.
Export publication figures
ax = ep.plot_eye_irt_information_profile(information)
ax.figure.set_size_inches(7, 4.5)
ax.figure.tight_layout()
ax.figure.savefig("irt-information.pdf", bbox_inches="tight")
ax.figure.savefig("irt-information.svg", bbox_inches="tight")
ax.figure.savefig("irt-information.png", dpi=300, bbox_inches="tight")
Vector formats such as SVG/PDF are useful for line art and text-heavy diagnostics; high-resolution PNG is useful when rasterized heatmaps or journal systems require it.
Missing Matplotlib
Core plotting helpers lazy-load Matplotlib. If plotting dependencies are unavailable, install them explicitly:
Some specialist plotting/model families can require additional optional scientific backends.
Reproduce the gallery
These deterministic scripts generate the visual examples used throughout the documentation without requiring private research data.