Data Quality plot gallery
This gallery shows how the standardized quality subsystem should be inspected visually. The figures use deterministic synthetic validation data from simulate_gaze_quality_calibration(seed=20260918); they demonstrate software behavior and are not empirical tracker benchmarks.
Build the same synthetic report
import eyeprocesspy as ep

validation = ep.simulate_gaze_quality_calibration(
    seed=20260918,
    samples_per_target=18,
    nominal_sampling_hz=60,
)

quality = ep.create_gaze_quality_report(
    validation,
    by=["profile", "target_id"],
    valid="valid",
    missing_reason="missing_reason",
    nominal_sampling_hz=60,
    bcea_probability=0.68,
    preprocessing_spec="synthetic raw validation samples; no interpolation",
    quality_rules="descriptive review only",
)

center_target = quality.loc[quality["target_id"].eq(5)].copy()
Dashboard preview
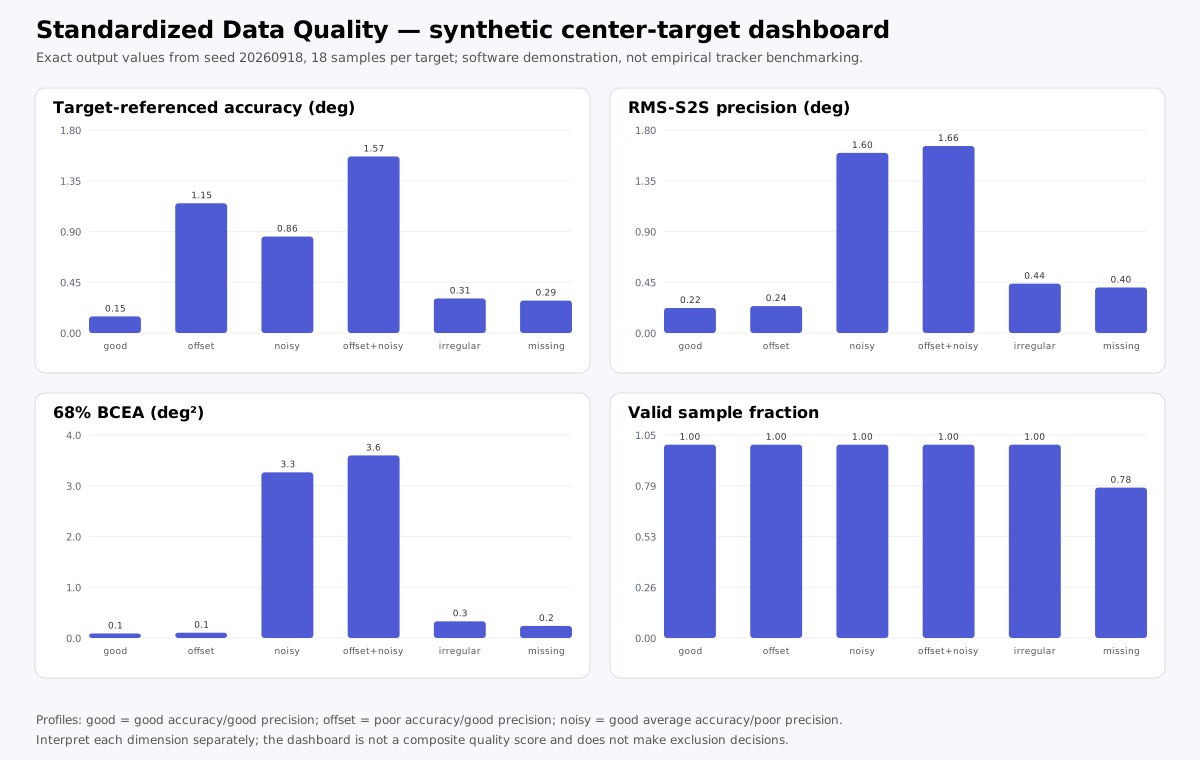
The dashboard deliberately keeps target error, short-term precision, spatial dispersion, and valid-data availability in separate panels. It is not a composite score and does not make an exclusion decision.
Generate the native Matplotlib dashboard with:
Target-referenced accuracy
Use it for: validation/check-target periods with known target coordinates.
Interpretation: higher error means recorded gaze lies farther from the known target. A stable systematic offset can therefore be precise but inaccurate.
Do not use it as: a measure of short-term stability, attention, engagement, or cognitive state.
RMS sample-to-sample precision
Use it for: successive-sample fluctuation during periods in which intended gaze position is stable.
Interpretation: larger values mean more adjacent-sample displacement. The implementation never bridges a missing sample.
Do not use it across: target changes, intentional saccades, or other periods where true gaze position is expected to move.
BCEA
Interpretation: BCEA summarizes spatial spread as an area. The canonical report stores both the area unit and the probability level (0.68 by default).
Boundary: BCEA is not target-referenced accuracy. Report its probability and unit whenever it is used.
Sampling-interval diagnostic
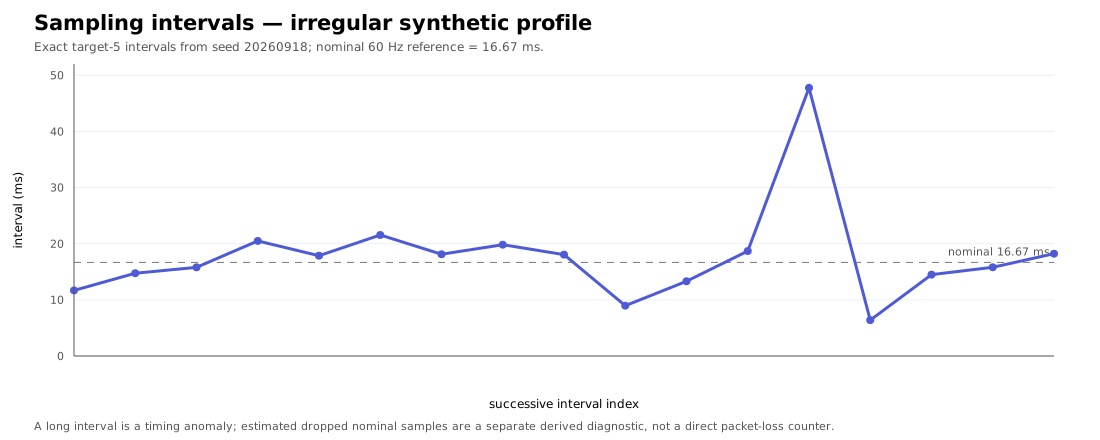
The preview above shows the exact target-5 inter-sample intervals from the seeded irregular_sampling profile.
Generate the corresponding native plot with:
irregular_center = validation.loc[
    validation["profile"].eq("irregular_sampling")
    & validation["target_id"].eq(5)
].copy()

ax = ep.plot_sampling_intervals(
    irregular_center,
    time="timestamp_ms",
    time_unit="ms",
)
The nominal 60 Hz period is about 16.67 ms, but nominal frequency alone does not prove a regular realized timebase. When nominal frequency is supplied, the report distinguishes:
long_interval_count: observed intervals exceeding the declared long-gap rule;dropped_interval_count: estimated missing nominal samples represented by those long gaps.
The second is a timing-derived estimate, not a direct hardware packet-loss counter.
Review-rule sensitivity
Quality thresholds belong to the analysis protocol, not to the plotting function.
reviewed = ep.create_gaze_quality_report(
    validation,
    by=["profile", "target_id"],
    valid="valid",
    missing_reason="missing_reason",
    nominal_sampling_hz=60,
    thresholds={
        "accuracy_mean": {"max": 1.0},
        "valid_sample_fraction": {"min": 0.80},
    },
)

reviewed[
    ["profile", "target_id", "quality_flags", "review_required"]
]
The original rows remain present. Filtering or exclusion, if scientifically justified, is a separate downstream decision. Compare substantive results under plausible pre-specified rules rather than choosing a cutoff after seeing the desired result.
Suggested manuscript wording
Eye-tracking data quality was characterized using target-referenced Euclidean accuracy, RMS sample-to-sample and spatial-SD precision, and 68% BCEA. Nominal sampling frequency was supplemented by timestamp-derived effective frequency and inter-sample diagnostics. Missing or explicitly invalid gaze was summarized by valid-data fraction, loss fraction, and loss-run duration. Pre-specified thresholds generated review flags rather than automatic exclusions, and sensitivity analyses evaluated whether substantive conclusions depended on quality decisions.
Adapt the sentence to the metrics actually used; do not report measures that were not computed.
The compact package-generated summary can be used as a reproducible starting point:
Limitations
These plots characterize the measurement process. They do not establish psychological attention, engagement, cognitive load, motivation, competence, or clinical status. Synthetic profiles validate software behavior and illustrate interpretation; they do not establish universal device-performance expectations or universal exclusion thresholds.