Visual atlas: detector multiverse and inference robustness
This page turns the event-detector multiverse workflow into a visual diagnostic sequence. The figures come from deterministic synthetic examples and are intended to show how to inspect robustness, not to establish preferred detector thresholds.
Synthetic evidence, not empirical findings
The worked data are generated with a fixed seed. Absolute values are examples only. Recreate the figures with your own declared detector set, AOIs, quality rules, and statistical model before drawing substantive conclusions.
What to inspect, in order
→
→
→
→
Visual diagnostic panel
1. Event agreement
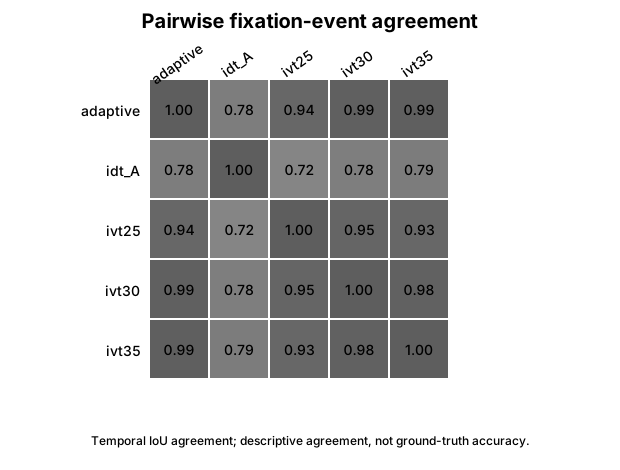
Use plot_detector_agreement() to inspect pairwise temporal overlap.
A high agreement value means two detector catalogues overlap strongly under the selected matching rule. It does not mean either detector is correct. Lower agreement tells you detector choice is changing the event representation enough to warrant downstream sensitivity checks.
2. AOI feature sensitivity
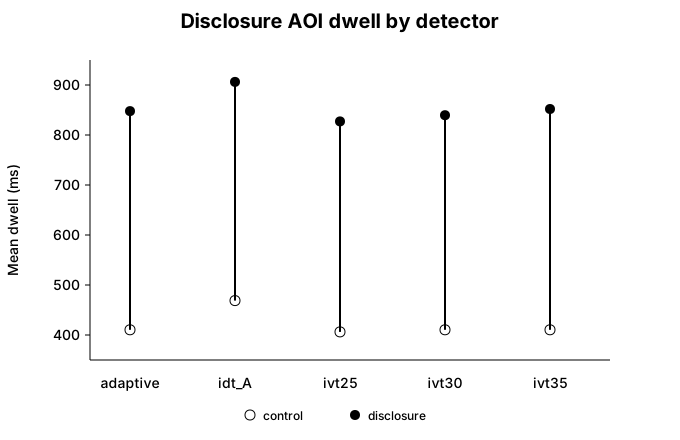
Use plot_detector_feature_distributions() after AOI assignment and feature propagation.
The seeded example retains the positive disclosure contrast across the successful internal branches, but the absolute dwell values move because fixation boundaries and fragmentation differ. In real data, report both the substantive contrast and the detector-to-detector spread.
3. Coefficient stability
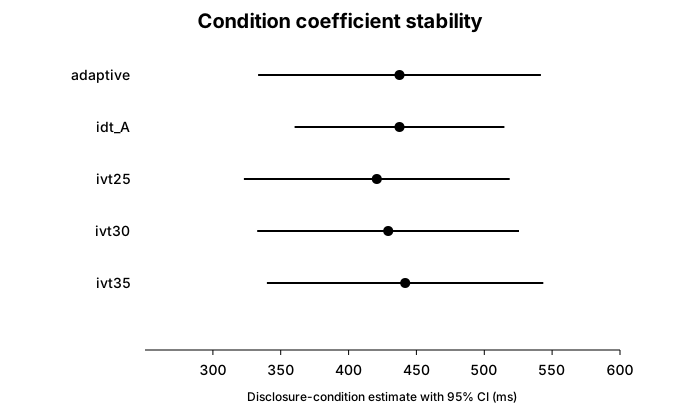
Fit the same declared model to each detector branch, then plot the requested term.
Read the coefficient plot together with assess_detector_inference_stability(). Directional stability can coexist with meaningful changes in magnitude or uncertainty. A narrow detector multiverse cannot establish robustness to preprocessing, AOI geometry, exclusion rules, or alternative model specifications that were not evaluated.
4. Planned-specification denominator
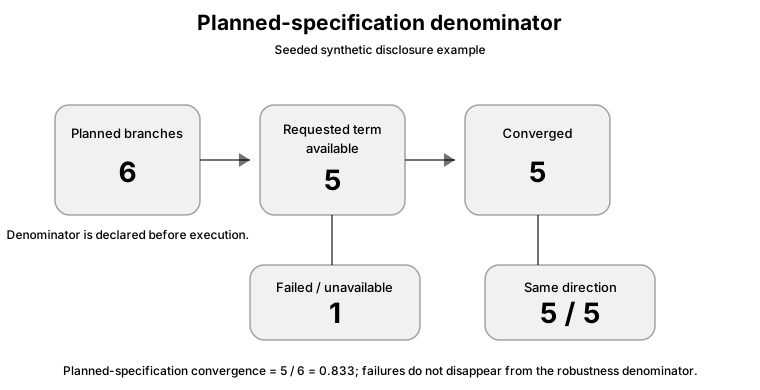
The seeded worked example declares six detector branches. Five internal branches return the requested coefficient; the unavailable REMoDNaV branch is retained as a failure. The resulting convergence rate is therefore 5/6, not 5/5.
stability = ep.assess_detector_inference_stability(
    inference,
    term=term,
    substantive_threshold=100,
)
The figure deliberately separates:
- planned specifications;
- branches returning the requested coefficient;
- converged branches;
- failed or unavailable branches;
- same-direction coefficients among available estimates.
Never redefine the denominator after seeing which branches succeed.
5. Model-input audit
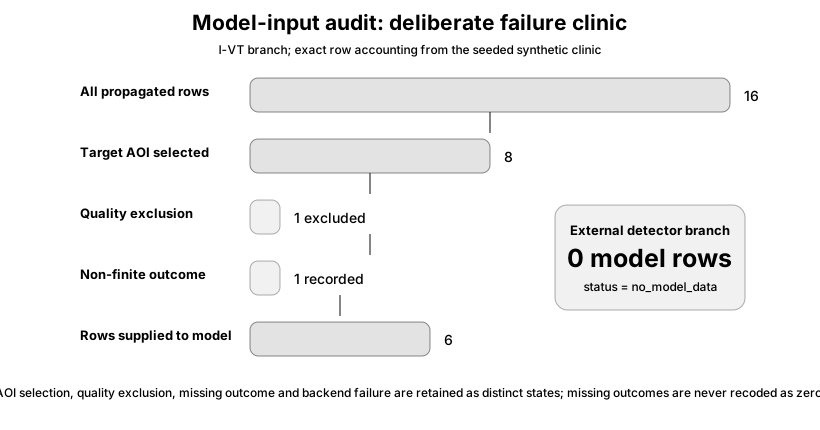
The failure-clinic example deliberately creates one quality exclusion and one non-finite outcome. The I-VT branch starts with 16 propagated rows, selects 8 rows for the target AOI, excludes 1 row under the declared quality threshold, records 1 non-finite outcome, and supplies 6 rows to the estimator.
inference.input_audit[
    [
        "detector_id",
        "input_rows",
        "aoi_selected_rows",
        "quality_excluded_rows",
        "outcome_missing_rows",
        "model_rows_used",
        "status",
    ]
]
This audit exists to prevent several common reporting errors: missing outcomes are never recoded as zero, quality exclusions remain distinct from the final model N, and failed detector branches do not disappear from the analysis history.
Publication-oriented figure sequence
For a paper or supplement, a compact sequence is usually enough:
- event-agreement matrix;
- detector-wise distribution of the primary gaze feature;
- coefficient-and-interval stability plot;
- model-input / failure-accounting table or figure.
A full multiverse should be described in the Methods even if only a subset of diagnostics appears in the main text.
Example figure caption
Detector-sensitivity diagnostics for the synthetic disclosure example. Pairwise event overlap describes temporal agreement among successful detector branches; detector-wise AOI dwell shows propagation of event-definition uncertainty into the measurement; coefficient intervals show propagation into the identical downstream model; and the planned-specification audit retains failed or unavailable branches in the robustness denominator. These diagnostics assess sensitivity to the declared detector set and do not establish detector accuracy.
When the visuals should change your interpretation
Treat detector sensitivity as substantively important when a defensible branch changes the sign of the focal effect, moves the estimate across a prespecified meaningful-effect threshold, produces materially different AOI measurements, or reveals systematic model-input loss. A single failed optional backend is not itself evidence against the substantive effect, but it must remain visible in the execution record.
Limitations
These plots do not validate a detector against ground truth, justify arbitrary threshold grids, replace device- and task-specific quality assessment, or show robustness to analytical choices outside the declared detector multiverse. Where externally coded events or a validated reference catalogue exist, use them as an additional validation layer rather than treating cross-detector agreement as truth.