Worked example: evidence verification
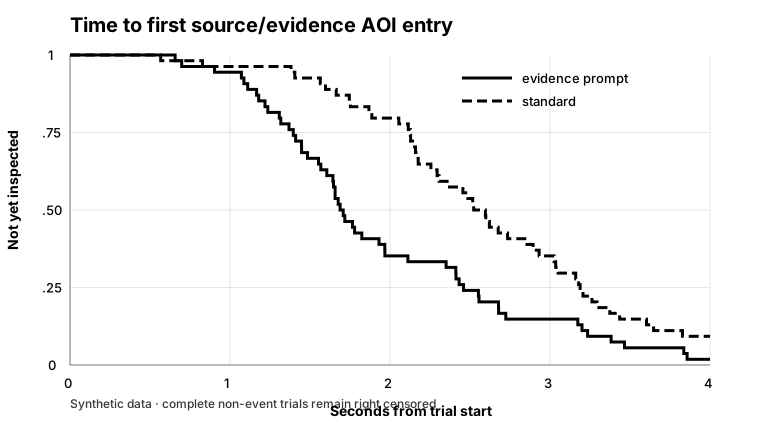
This example models time to first entry into a source/evidence AOI. Repeated trials are assigned to standard or evidence_prompt conditions. Some complete usable trials never inspect the evidence AOI and therefore remain right censored.
1. Generate raw trial and AOI-visit inputs
from eyeprocesspy.survival import simulate_gaze_survival_inputs

raw = simulate_gaze_survival_inputs(
    "verification",
    seed=20260918,
    n_participants=36,
    trials_per_participant=3,
)
The input remains a raw trial/event representation. No censoring flag is supplied by the generator.
2. Construct the survival table
from eyeprocesspy.survival import prepare_gaze_survival_data

verification = prepare_gaze_survival_data(
    raw["trials"],
    raw["events"],
    target_aoi="source_evidence",
    event_type="first_aoi_entry",
    condition_col="condition_id",
    min_valid_fraction=0.90,
    event_detector="synthetic_truth",
    aoi_specification="fixed synthetic source/evidence AOI",
)
A usable trial with no source/evidence entry becomes event_observed = 0 with analysis_time = censor_time. A trial with an unresolved observation window or unusable gaze remains a review case instead.
3. Audit censoring before modelling
from eyeprocesspy.survival import (
    summarise_gaze_censoring,
    validate_gaze_survival_data,
)

print(validate_gaze_survival_data(verification, raise_on_error=False))
print(summarise_gaze_censoring(verification, by="condition"))
Condition-specific censoring should be reported because differential follow-up or target inspection can change how the model is interpreted.
4. Fit the repeated-participant Cox model
from eyeprocesspy.survival import fit_gaze_mixed_cox_model

cox = fit_gaze_mixed_cox_model(
    verification,
    "C(condition)",
    participant_col="participant_id",
    structure="cluster_robust",
)
The hazard ratio describes the relative instantaneous evidence-inspection rate among trials still at risk. It is not a ratio of mean inspection times.
5. Add explicitly named AFT sensitivity models
from eyeprocesspy.survival import fit_gaze_aft_model

weibull = fit_gaze_aft_model(
    verification,
    "C(condition)",
    distribution="weibull",
)
lognormal = fit_gaze_aft_model(
    verification,
    "C(condition)",
    distribution="lognormal",
)
Interpret the exponentiated AFT coefficient as a time ratio under the named parametric family. Do not choose the family by whichever model yields the smaller p-value.
6. Diagnose and report
from eyeprocesspy.survival import (
    check_gaze_proportional_hazards,
    compare_gaze_survival_models,
    report_gaze_survival_model,
    tidy_gaze_survival_model,
)

print(tidy_gaze_survival_model(cox))
print(check_gaze_proportional_hazards(cox))
print(compare_gaze_survival_models(cox, weibull, lognormal))
print(report_gaze_survival_model(cox))
Cox partial-likelihood and AFT full-likelihood information criteria are not treated as rank-comparable across families.
7. Plot the inspection process
from eyeprocesspy.survival import plot_gaze_survival_curve

ax = plot_gaze_survival_curve(verification, group="condition")
ax.set_title("Time to first source/evidence AOI entry")
Lower survival at a given time means a larger share of trials has already inspected the evidence AOI.
Read the same process as 1−KM
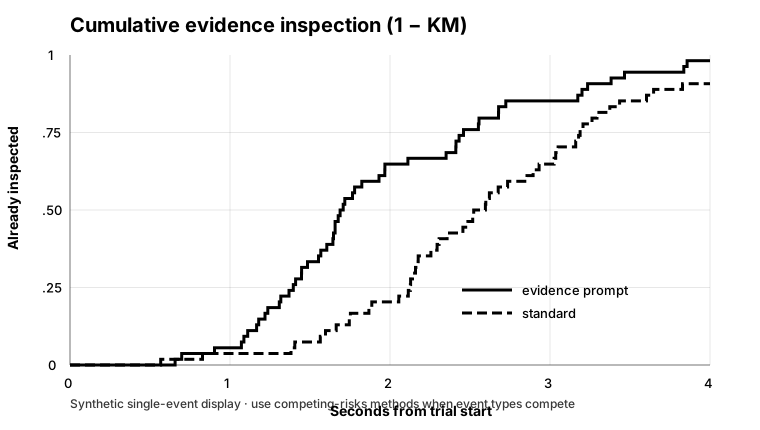
Here 1−KM is simply the complement of the Kaplan–Meier survival function for one target event. It should not be interpreted as a competing-risks cumulative-incidence estimator.
Audit event and censor counts
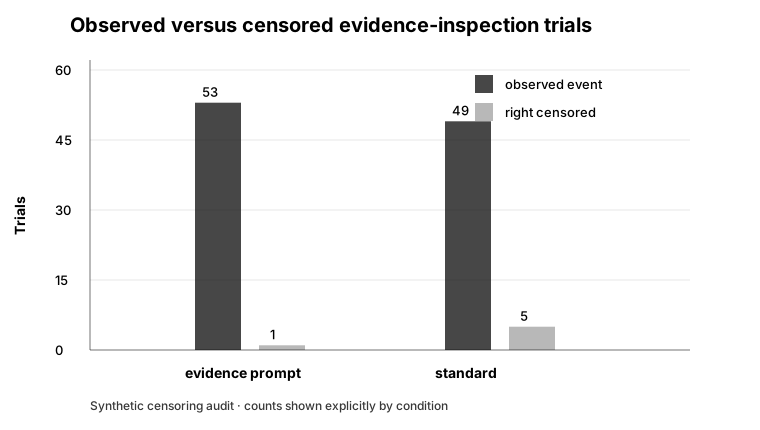
The synthetic verification example contains 54 trials per condition. The visual makes the event/censor balance inspectable before any regression coefficient is interpreted.
8. Manuscript interpretation
A compact interpretation should state the event definition, AOI, time origin, censoring rule, repeated-participant structure, effect measure, diagnostics, and whether the conclusion is robust to alternative AOI/event/quality specifications.
Use the copyable reporting template rather than reporting the model coefficient in isolation.
Troubleshooting links
The repository script examples/worked_gaze_verification_survival.py executes this workflow and writes censoring summaries, model outputs, diagnostics, a JSON reporting bundle, and an SVG Kaplan–Meier figure.