Visual reference
996102e0
Plot gallery
Every figure on this page is generated by executable Python in tools/generate_plot_gallery.py. The committed SVGs are regenerated under a pinned Matplotlib environment in CI and the workflow fails on byte drift. Gallery metadata is governed separately in _data/plots.yml, so plot-to-method links and the practical route that follows each visual are checked rather than duplicated by hand in this page.
Install plotting support with:
python -m pip install "gazeaudit[plot]"
Choose a plot by research question
| Research question | Plot |
|---|---|
| Where are structural data problems concentrated? | Structural QC issue profile |
| Which trial or participant units need readiness review? | Trial readiness · Participant readiness |
| What would a declared readiness policy retain? | Cohort impact · Policy trade-offs · Threshold sensitivity |
| How does the endpoint vary across specifications? | Specification curve |
| Which declared factors align with the largest endpoint shifts? | Factor sensitivity |
| How does the endpoint respond to added missingness or lower-rate representation? | Missingness sensitivity · Sampling sensitivity |
| How does gaze relate spatially to a declared AOI? | Gaze trajectory and AOI |
| How does membership change around an AOI boundary? | AOI probability profile |
| Where does recovery hold over two perturbation dimensions? | Recovery matrix |
spatial_sensitivity_curve() produces an ordered sensitivity table across declared error-model scales. Use plot_sensitivity_curve() on the endpoint or risk quantity you intend to report, and preserve AOI identity explicitly when the table contains multiple AOIs. See the sensitivity-analysis design guide.
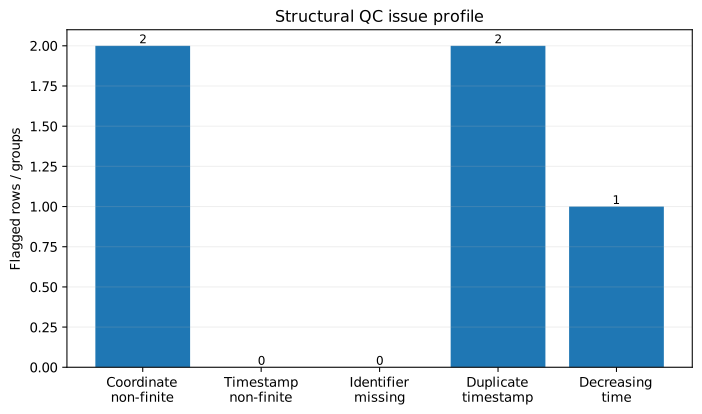
plot_qc_issue_profileStructural QC issue profile
QuestionWhere are the structural data-shape problems concentrated?
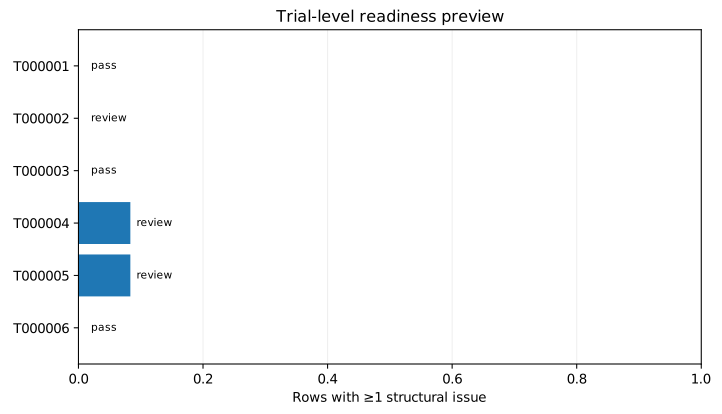
plot_trial_readinessTrial-level readiness preview
QuestionWhich participant-by-trial cells would fail the declared readiness policy?
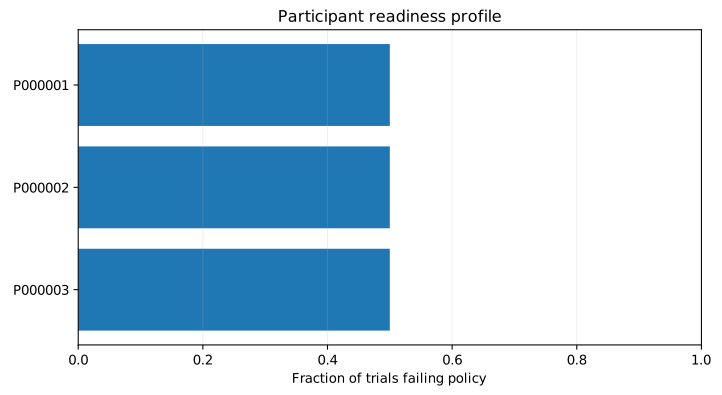
plot_participant_readinessParticipant readiness profile
QuestionWhich participants accumulate the largest fraction of policy-failing trials?
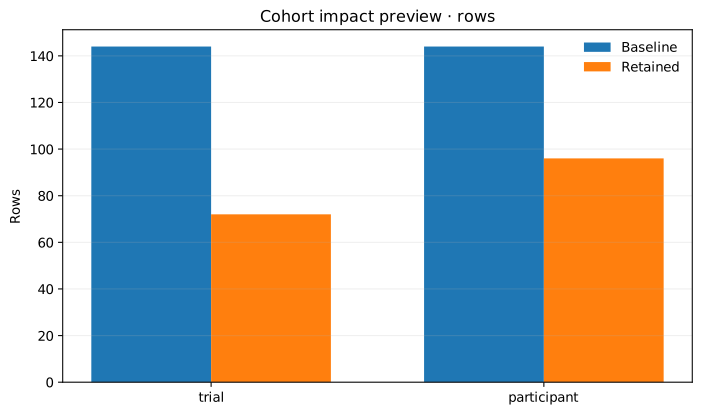
plot_cohort_impactCohort impact preview
QuestionHow much data would remain before any exclusion is actually applied?
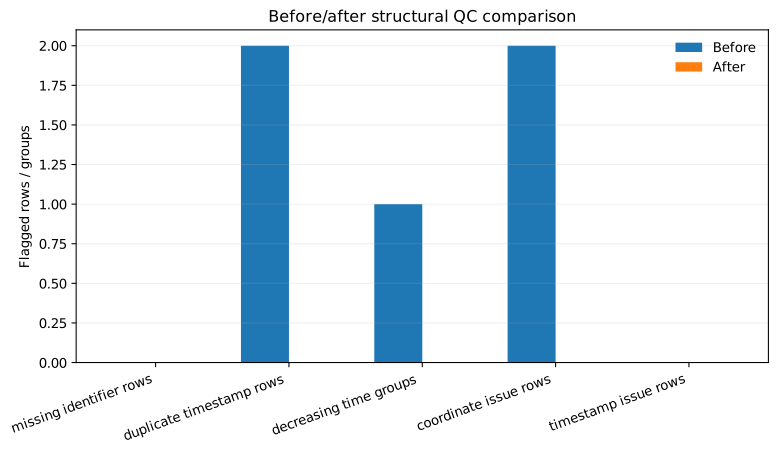
plot_repair_comparisonBefore/after structural QC
QuestionWhat changed after an explicitly performed repair?
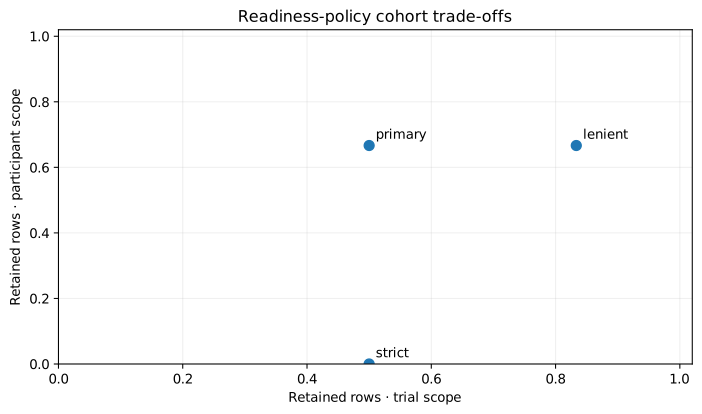
plot_policy_tradeoffsReadiness-policy cohort trade-offs
QuestionHow do alternative researcher-declared policies change cohort retention?
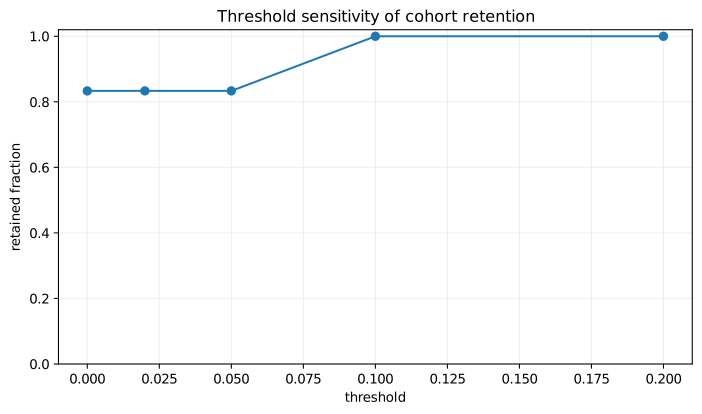
plot_threshold_sweepThreshold sensitivity
QuestionHow sensitive is retained cohort size to a declared threshold?
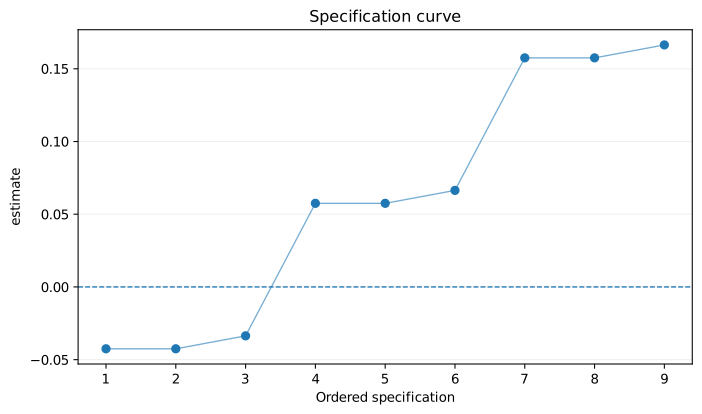
plot_specification_curveSpecification curve
QuestionHow does the endpoint vary across the declared specification space?
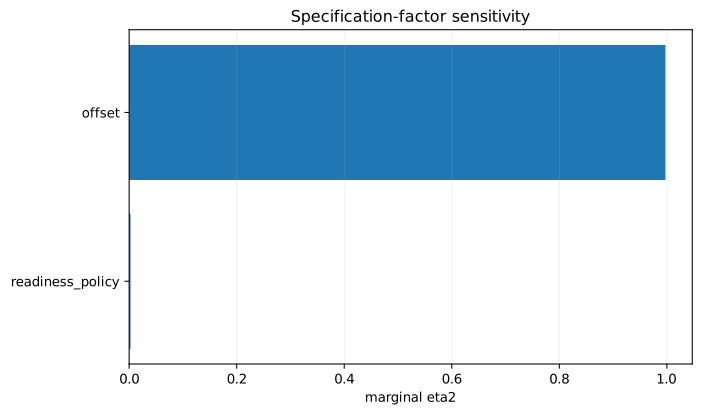
plot_factor_sensitivitySpecification-factor sensitivity
QuestionWhich declared analytical factors are associated with the largest endpoint shifts?
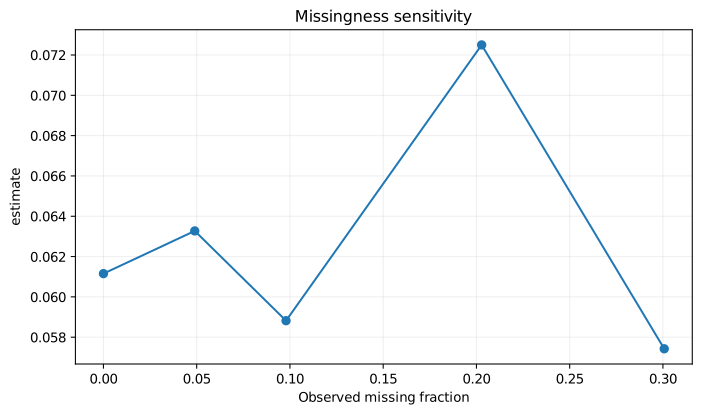
plot_sensitivity_curveMissingness sensitivity
QuestionHow does the endpoint behave under controlled missingness perturbations?
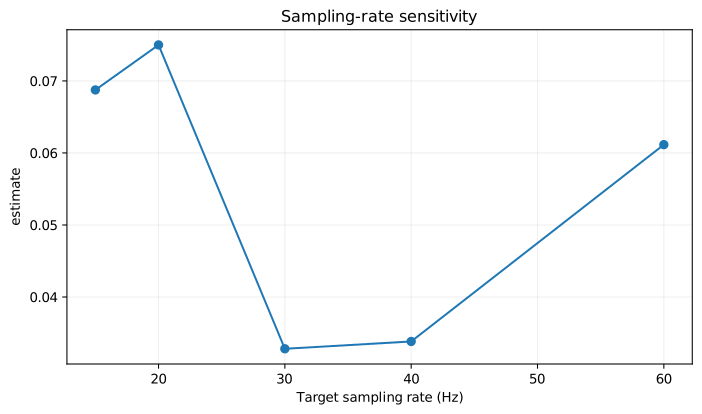
plot_sensitivity_curveSampling-rate sensitivity
QuestionHow does the endpoint behave across controlled target sampling rates?
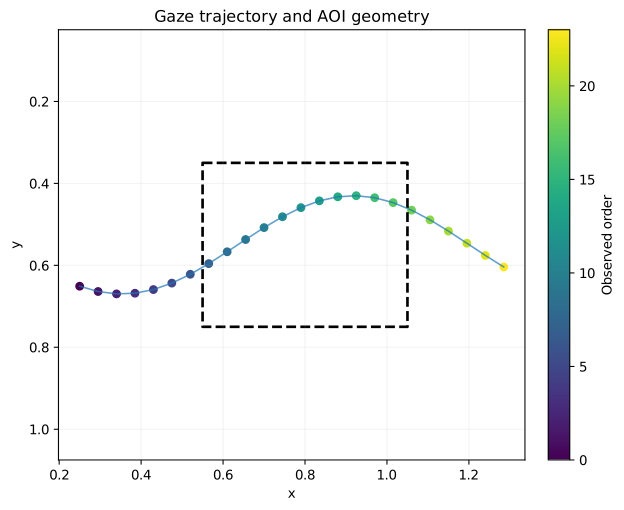
plot_gaze_trajectoryGaze trajectory and AOI
QuestionHow does a gaze path relate spatially to an explicit AOI?
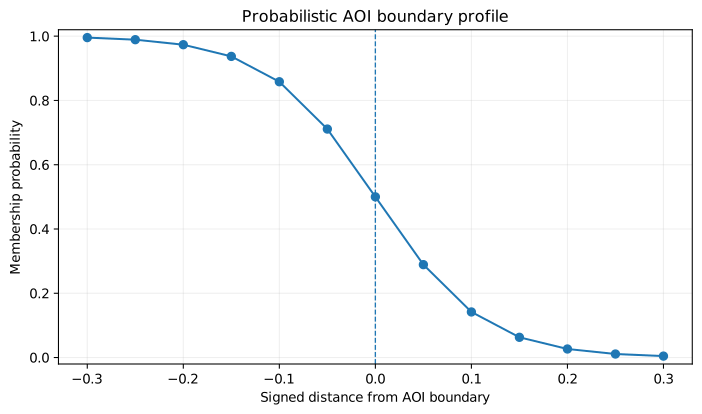
plot_aoi_probability_profileProbabilistic AOI boundary profile
QuestionHow does AOI membership probability change around a boundary?
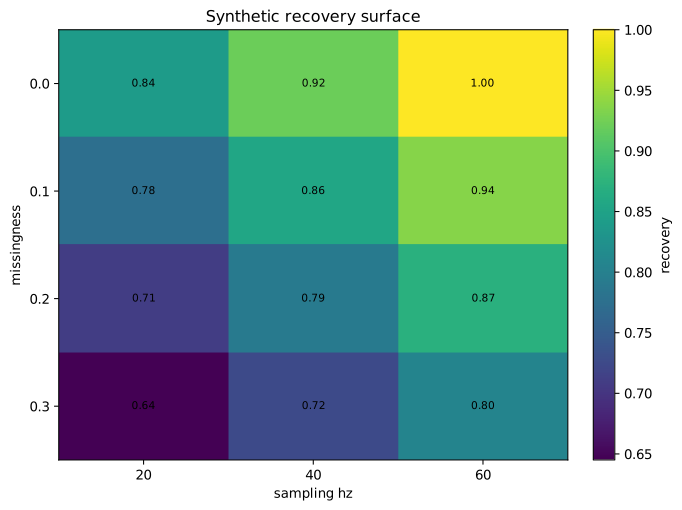
plot_recovery_matrixRecovery matrix
QuestionWhere does endpoint recovery hold across two perturbation dimensions?
No plots match this filter.
Reproduce the whole gallery
python -m pip install -e ".[plot]" "matplotlib==3.10.8"
python tools/generate_plot_gallery.py
The plot-gallery workflow regenerates the gallery and requires the working tree under assets/plots/ to remain unchanged. The docs-site workflow also validates the generated plot-index.json against the governed method catalog, the practical continuation routes, and published SVG routes. This keeps the public figures executable and the research navigation auditable.
Public plotting functions
The gallery is produced with the public plotting helpers plot_qc_issue_profile, plot_trial_readiness, plot_participant_readiness, plot_cohort_impact, plot_repair_comparison, plot_policy_tradeoffs, plot_threshold_sweep, plot_specification_curve, plot_factor_sensitivity, plot_sensitivity_curve, plot_gaze_trajectory, plot_aoi_probability_profile, and plot_recovery_matrix.