Plot fitted scanpath clusters
Source:R/scanpath_clustering_workflow.R
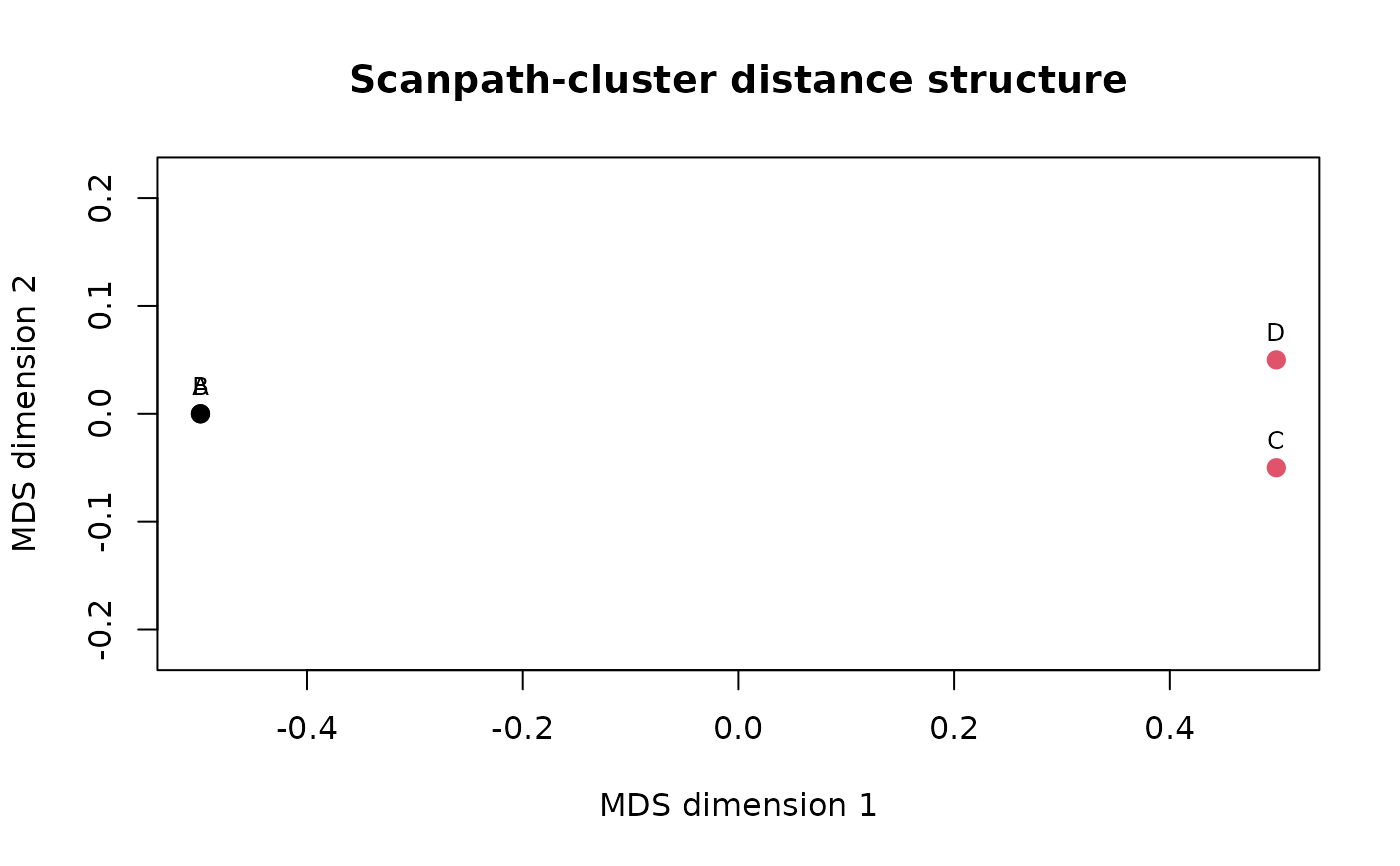
plot_gazepoint_scanpath_clusters.RdCreate base-R MDS, dendrogram, or silhouette diagnostics for an
object returned by cluster_gazepoint_scanpaths().
Usage
plot_gazepoint_scanpath_clusters(
  x,
  plot = c("mds", "dendrogram", "silhouette"),
  labels = TRUE,
  main = NULL,
  xlab = NULL,
  ylab = NULL,
  point_cex = 1.2,
  label_cex = 0.8
)
Arguments
- x
An object returned by
cluster_gazepoint_scanpaths().- plot
Plot type:
"mds","dendrogram", or"silhouette".- labels
Should scanpath identifiers be displayed?
- main
Optional plot title.
- xlab
Optional horizontal-axis label.
- ylab
Optional vertical-axis label.
- point_cex
Point-size multiplier for the MDS display.
- label_cex
Label-size multiplier.
Value
Invisibly returns a list containing the plot type, plot data, clustering method, and number of clusters.
Details
These displays describe distance structure and cluster separation. They do not establish distinct cognitive or psychological strategies.
Examples
d <- matrix(
  c(
    0, 0.1, 1, 1,
    0.1, 0, 1, 1,
    1, 1, 0, 0.1,
    1, 1, 0.1, 0
  ),
  nrow = 4,
  byrow = TRUE,
  dimnames = list(LETTERS[1:4], LETTERS[1:4])
)

fit <- cluster_gazepoint_scanpaths(d, k = 2)
plot_gazepoint_scanpath_clusters(fit, plot = "mds")