This article is a website-only showcase of representative visual
outputs in gp3tools. It is intended for users, reviewers,
and readers who want to see the visual diagnostics and reporting plots
produced by the package.
The gallery uses only package-safe synthetic or example data. It should not be read as an empirical analysis of real participants.
Important note
gp3tools can parse official Gazepoint Analysis summary
exports, but metrics recomputed from all-gaze and fixation files may not
always exactly reproduce Gazepoint’s internal summary calculations. For
official Gazepoint summary values, use
read_gazepoint_summary(). For transparent reproducible
calculations from exported rows, use the sample-level and fixation-level
summary functions.
Exported plot functions
#> plot_function
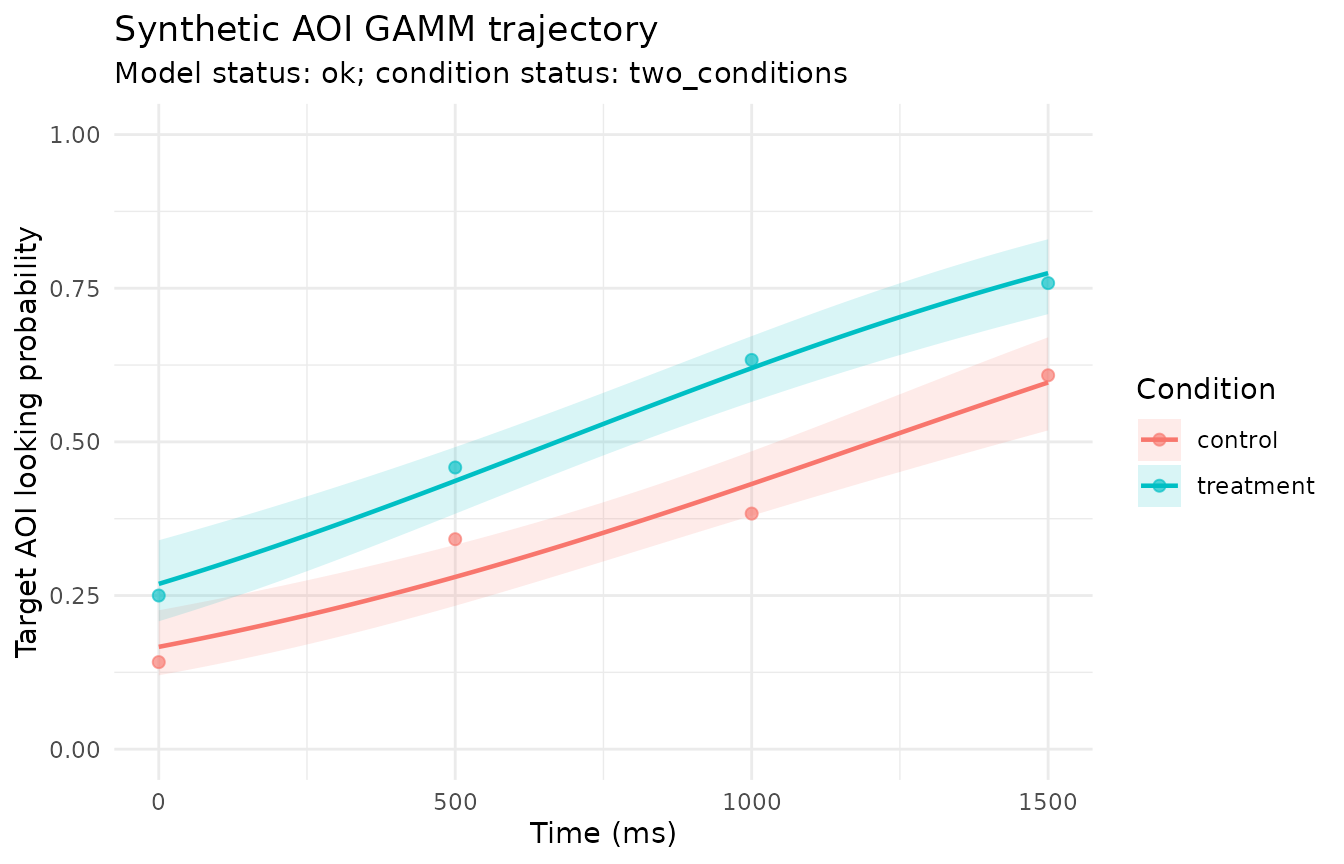
#> 1 plot_gazepoint_aoi_gamm
#> 2 plot_gazepoint_aoi_timeline
#> 3 plot_gazepoint_aoi_transition_matrix
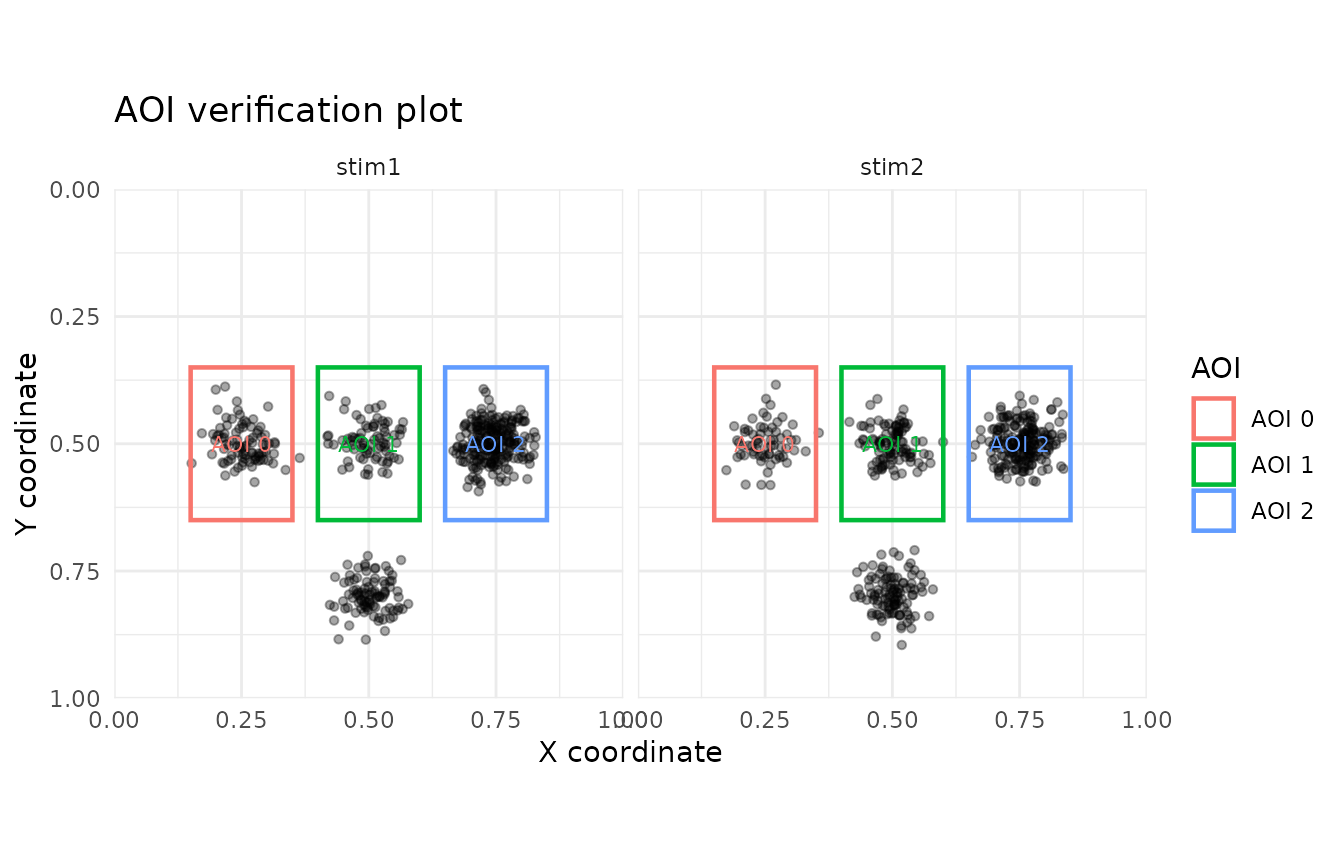
#> 4 plot_gazepoint_aoi_verification
#> 5 plot_gazepoint_cluster_null_distribution
#> 6 plot_gazepoint_cluster_permutation
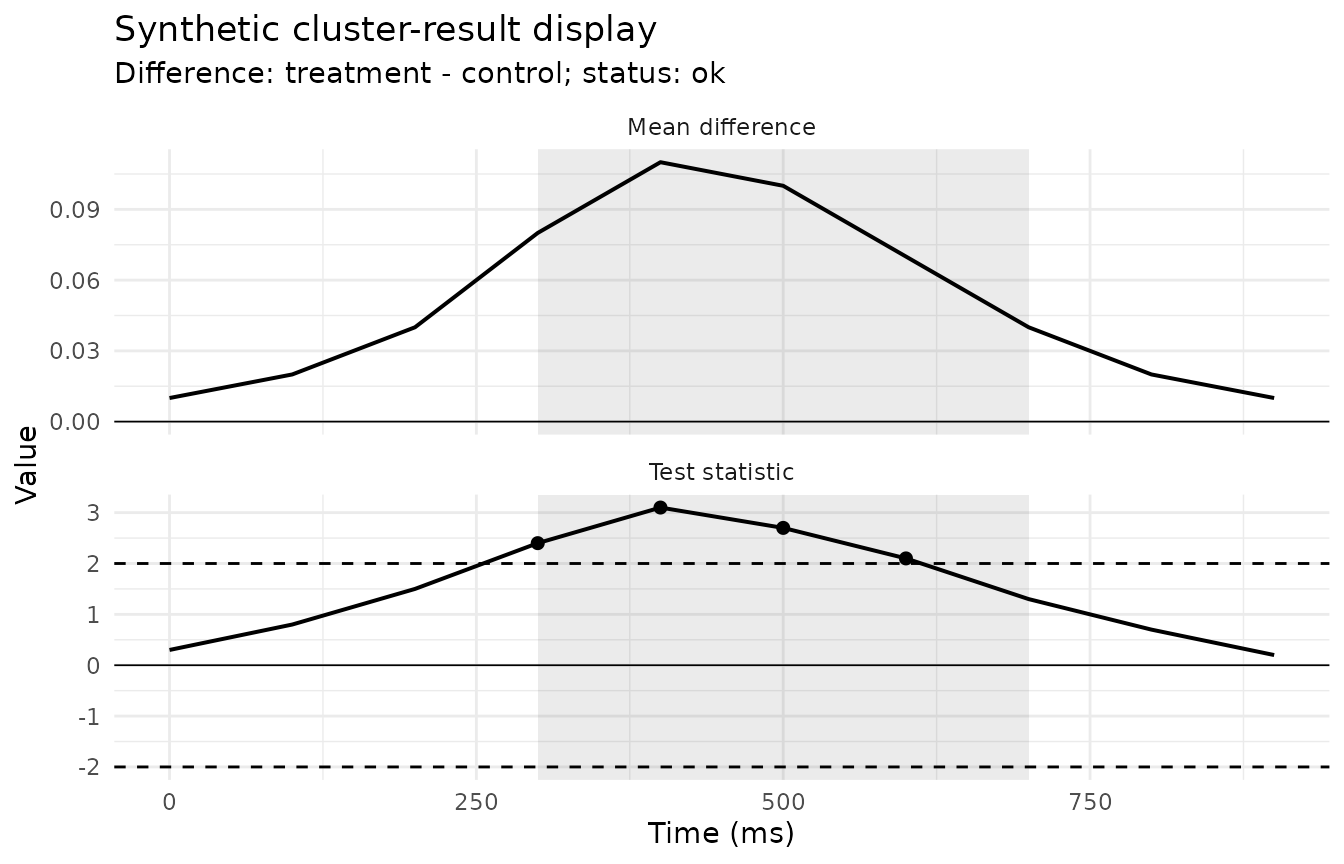
#> 7 plot_gazepoint_cluster_results
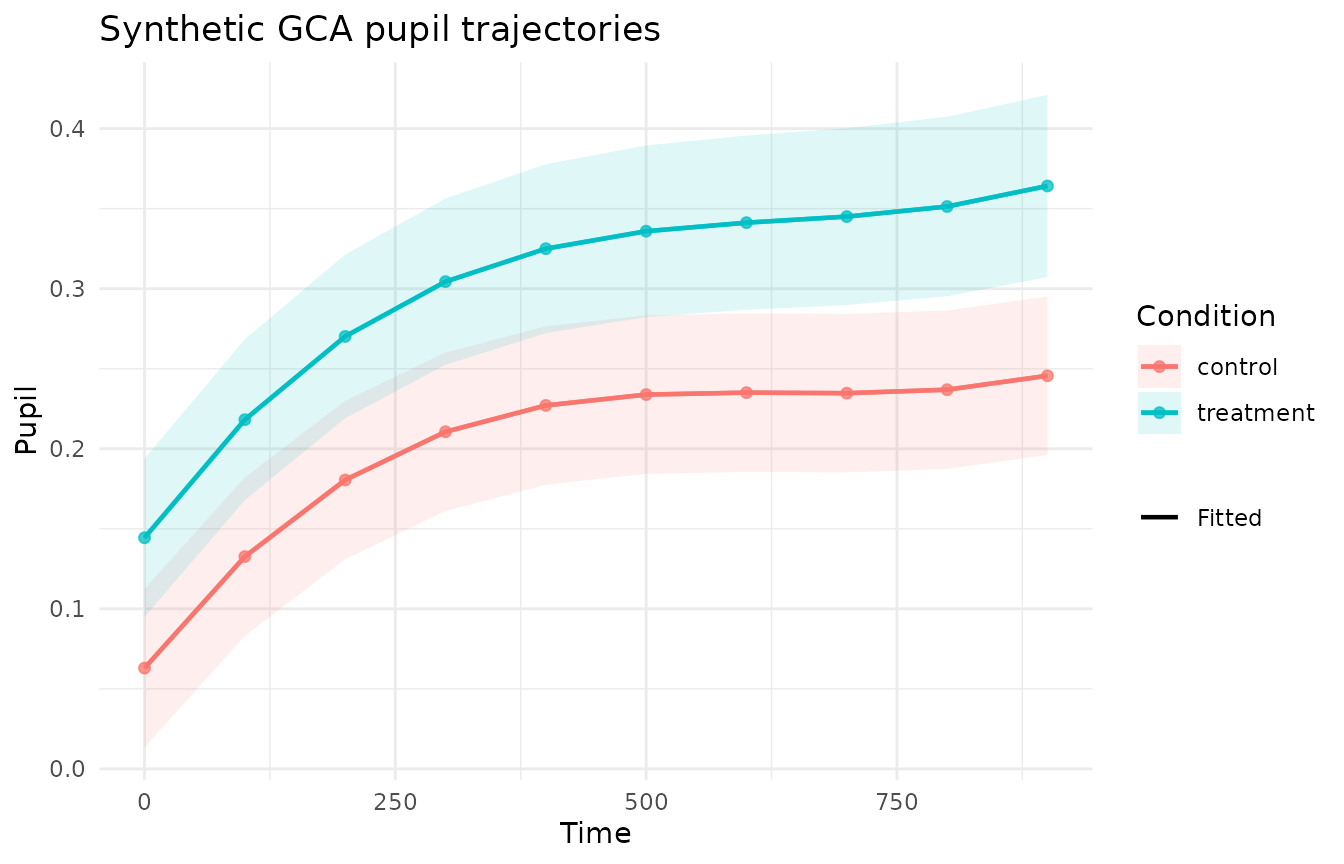
#> 8 plot_gazepoint_gca
#> 9 plot_gazepoint_heatmap
#> 10 plot_gazepoint_heatmap_overlay
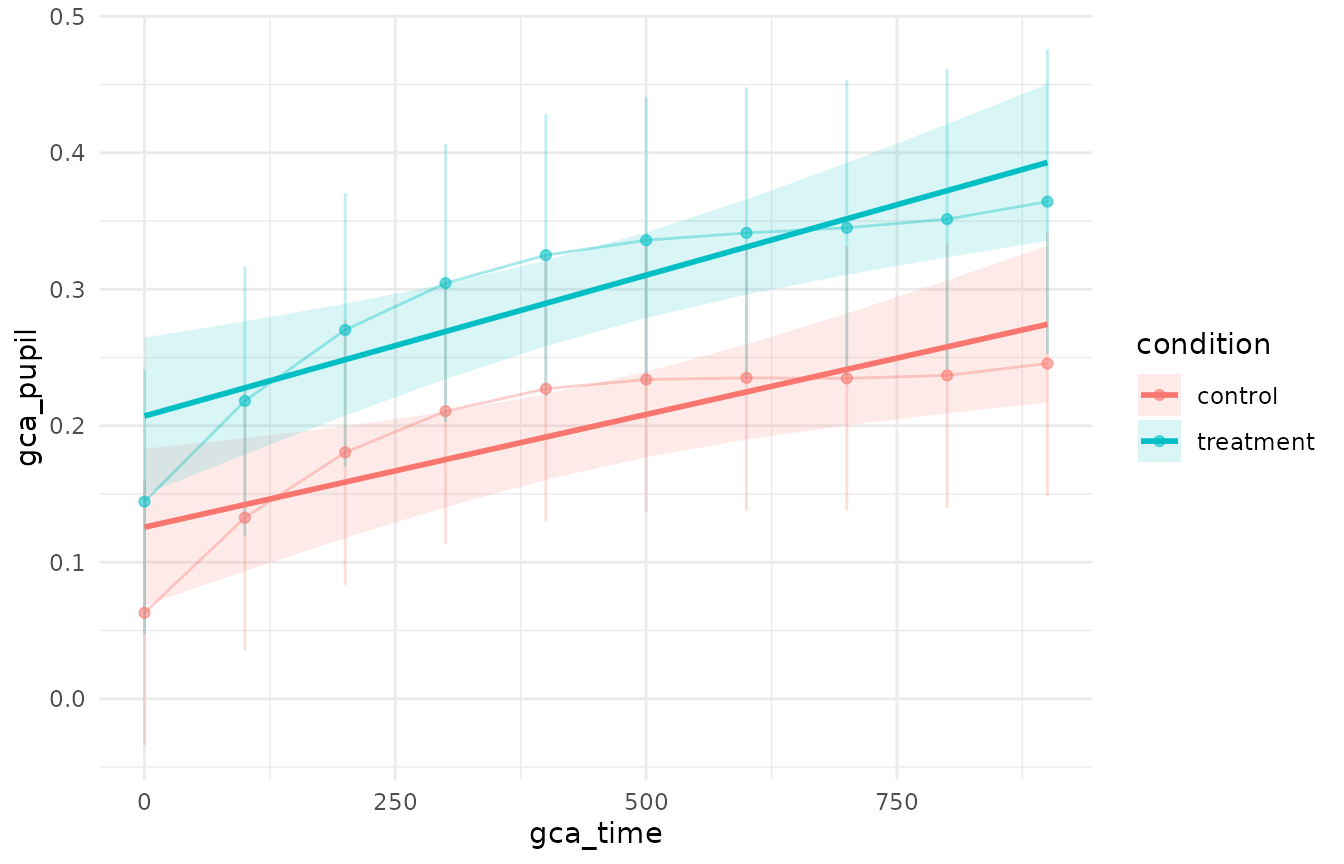
#> 11 plot_gazepoint_model_predictions
#> 12 plot_gazepoint_model_residuals
#> 13 plot_gazepoint_multiverse_results
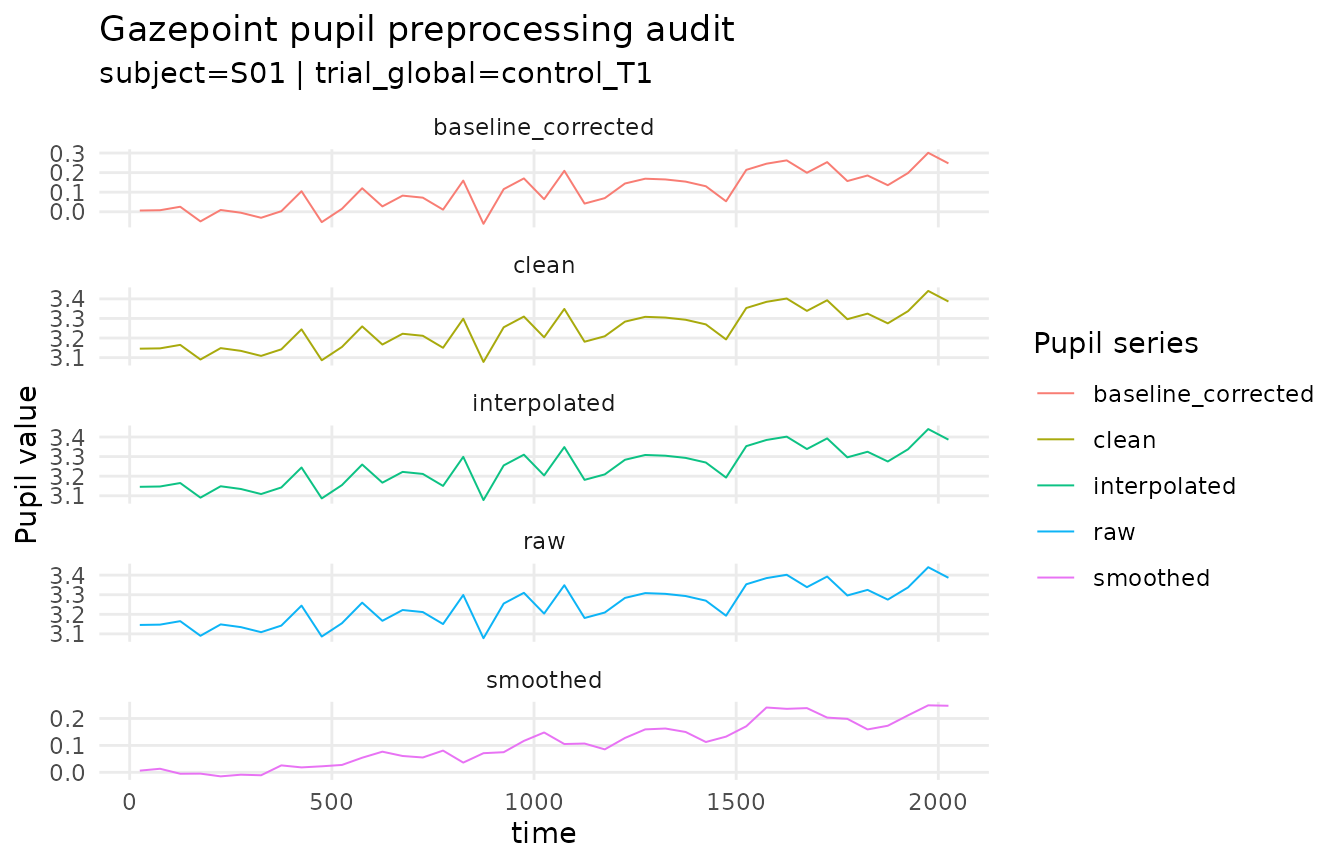
#> 14 plot_gazepoint_pupil_preprocessing
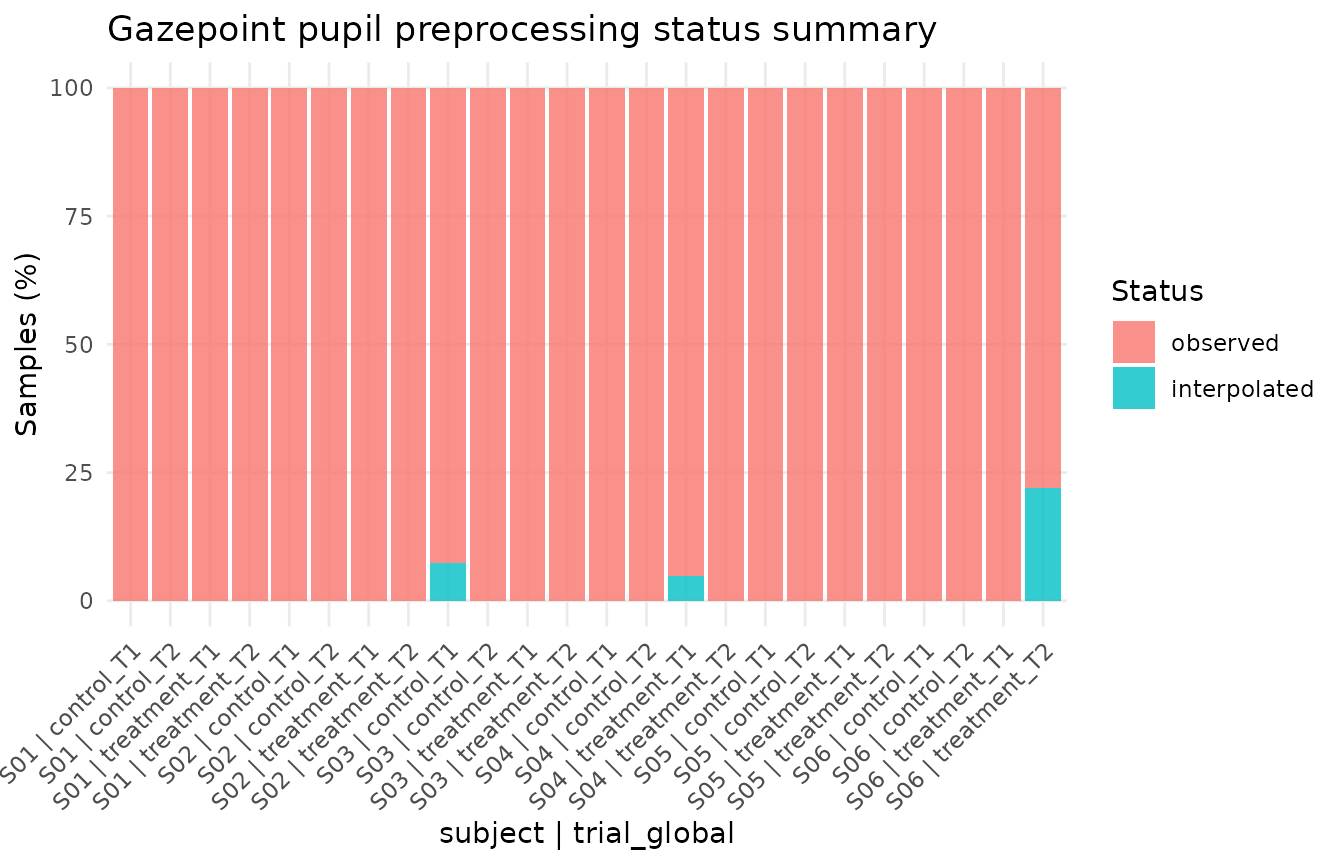
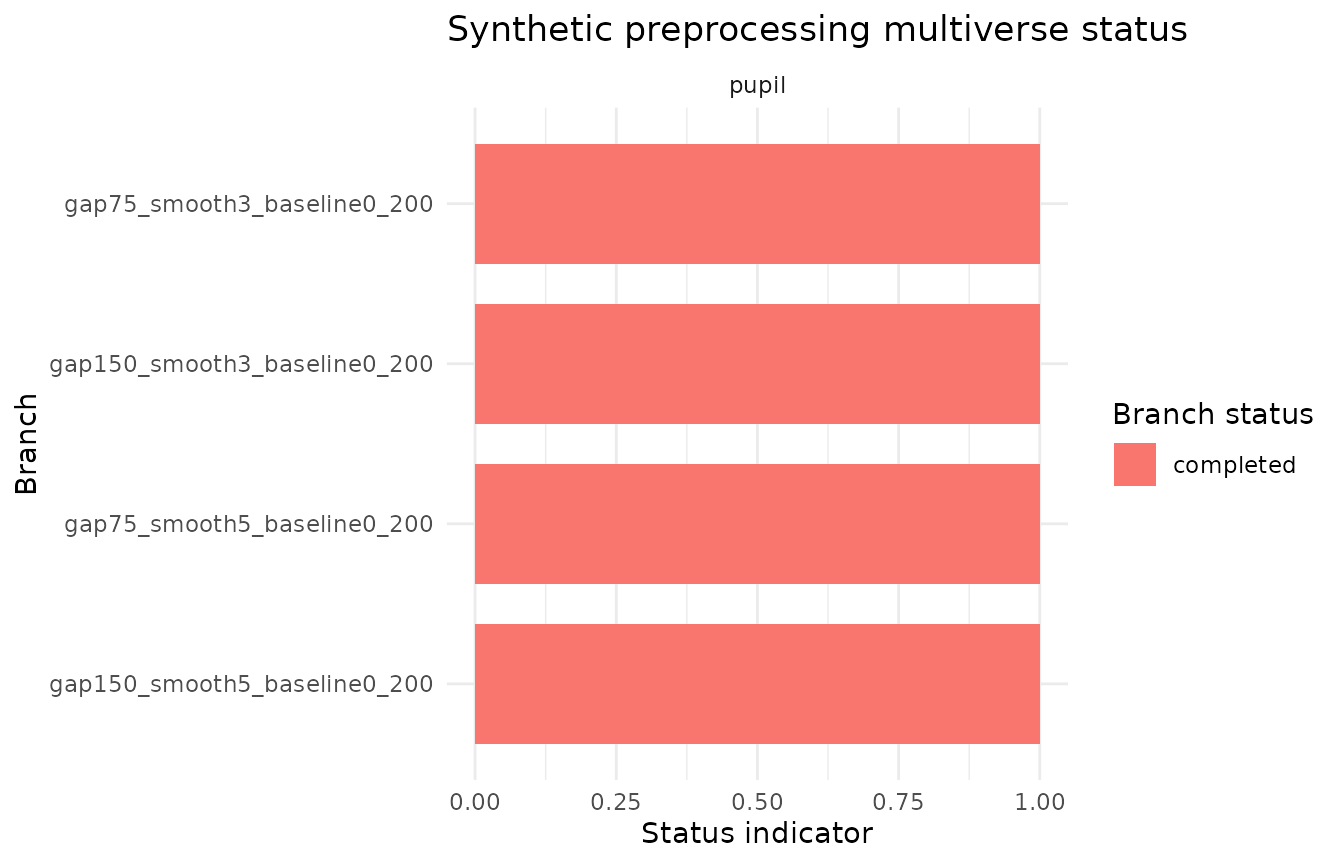
#> 15 plot_gazepoint_pupil_status
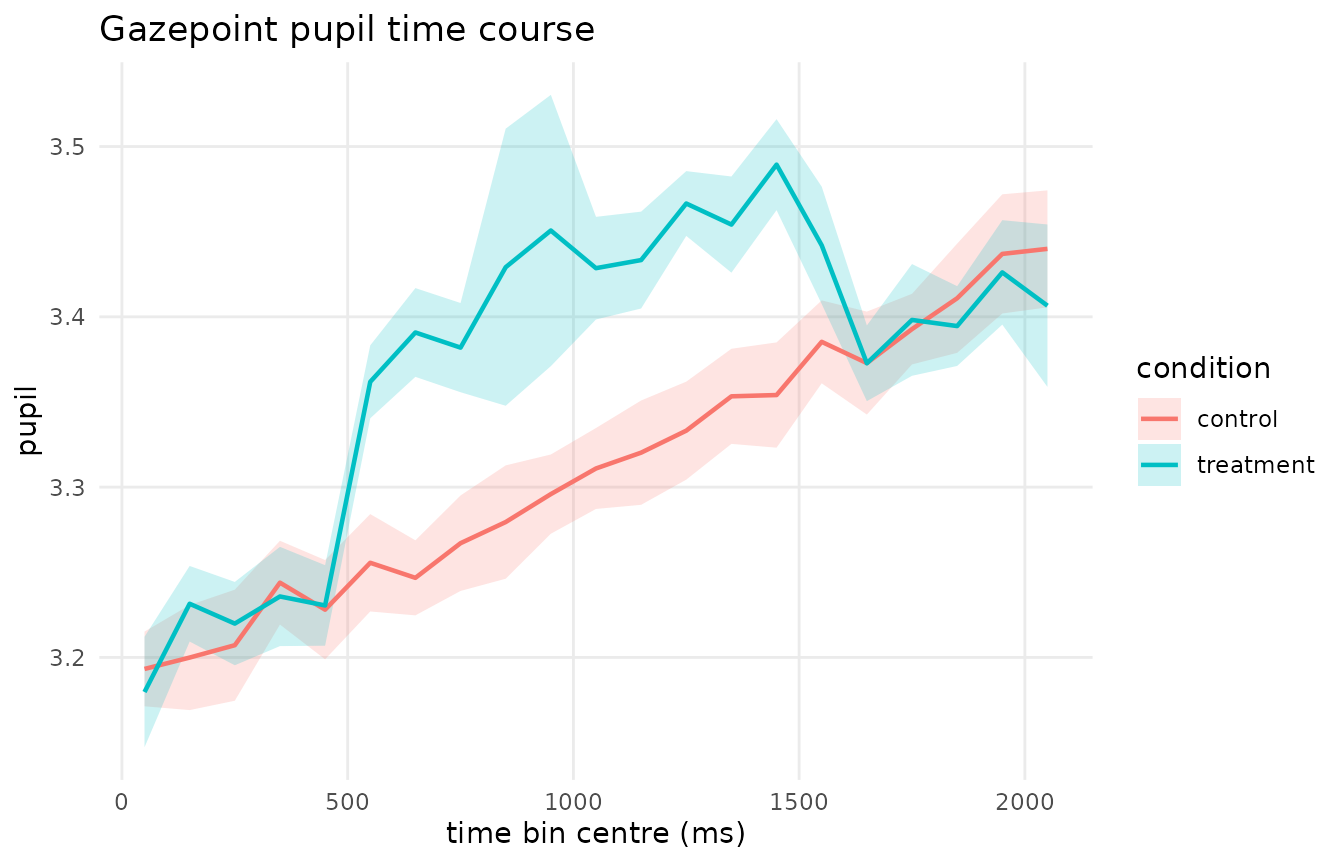
#> 16 plot_gazepoint_pupil_timecourse
#> 17 plot_gazepoint_scanpath
#> 18 plot_gazepoint_scanpaths
#> 19 plot_gazepoint_time_series
#> 20 plot_gazepoint_time_varying_effect
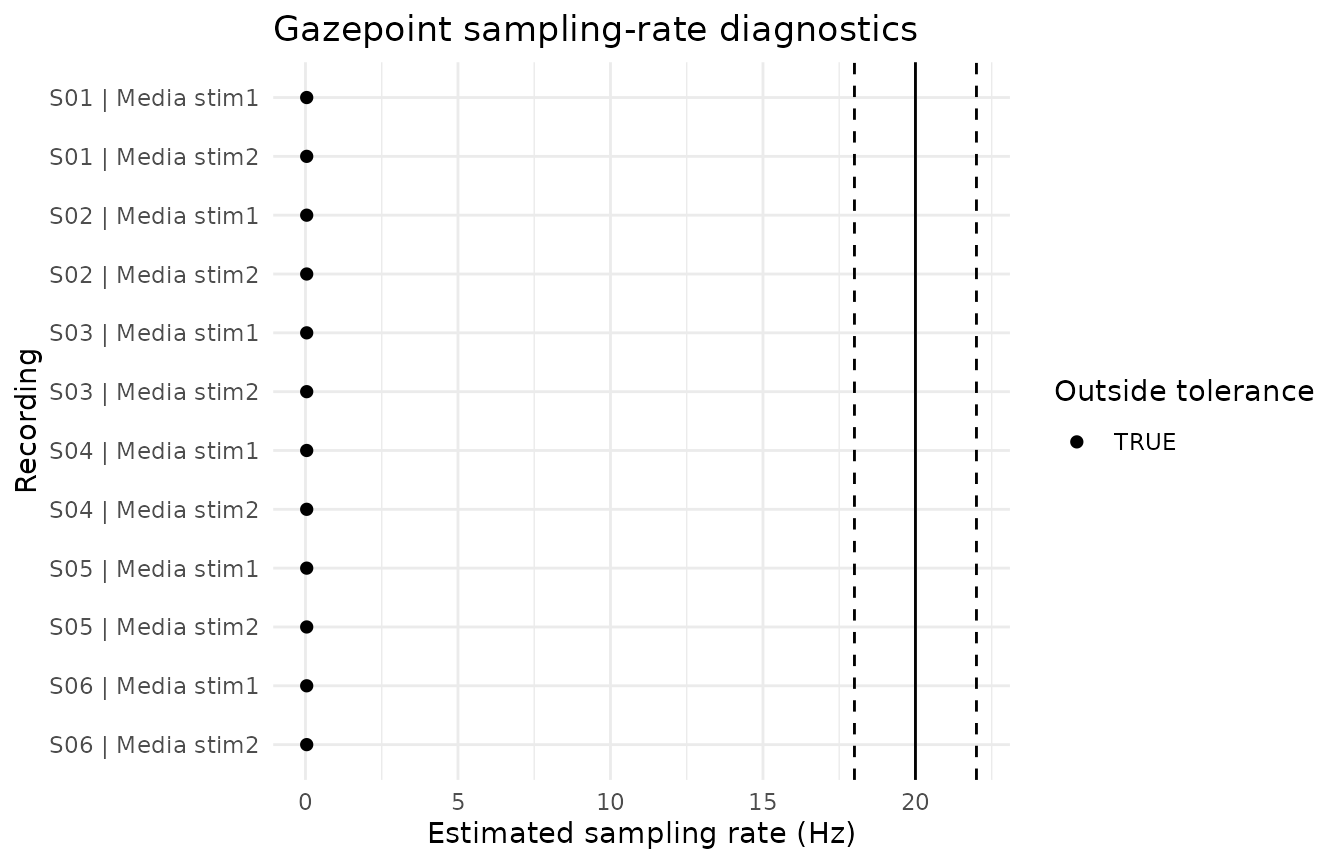
#> 21 plot_sampling_rate
#> 22 plot_tracking_quality
#> 23 plot_transition_heatmap