
Task-phase segmentation and coverage reporting
Source:vignettes/articles/phase-segmentation-reporting.Rmd
phase-segmentation-reporting.RmdThis article demonstrates helpers for assigning Gazepoint-style samples to declared task phases and summarising phase-level data coverage. These helpers are descriptive. They do not infer experimental phases, define exclusion rules, or replace study-specific preprocessing decisions.
Example data and phase windows
A typical eye-tracking task may include baseline, stimulus, response, and recovery periods. The phase windows should be declared explicitly by the analyst.
gaze_data <- data.frame(
  subject = rep(c("S1", "S2"), each = 12),
  trial = rep(rep(1:2, each = 6), times = 2),
  condition = rep(c("control", "treatment"), each = 12),
  time_ms = rep(c(0, 250, 750, 1250, 1750, 2250), times = 4),
  pupil = c(
    3.1, 3.0, 3.2, 3.3, NA, 3.2,
    3.0, 3.1, 3.3, 3.4, 3.5, 3.4,
    3.2, NA, 3.4, 3.5, 3.6, 3.5,
    3.1, 3.2, 3.3, NA, 3.4, 3.3
  )
)

phase_windows <- data.frame(
  phase = c("baseline", "stimulus", "response", "recovery"),
  start = c(0, 500, 1500, 2000),
  end = c(500, 1500, 2000, 2500)
)

phase_windows
#>      phase start  end
#> 1 baseline     0  500
#> 2 stimulus   500 1500
#> 3 response  1500 2000
#> 4 recovery  2000 2500
Segment samples into task phases
segment_gazepoint_task_phases() assigns each row to the
first declared phase window that contains its timestamp. Rows outside
the declared windows are labelled separately.
segmented <- segment_gazepoint_task_phases(
  gaze_data,
  time_col = "time_ms",
  phase_windows = phase_windows,
  keep_window_metadata = TRUE
)

head(segmented)
#>   subject trial condition time_ms pupil task_phase .gp3_phase_assigned
#> 1      S1     1   control       0   3.1   baseline                TRUE
#> 2      S1     1   control     250   3.0   baseline                TRUE
#> 3      S1     1   control     750   3.2   stimulus                TRUE
#> 4      S1     1   control    1250   3.3   stimulus                TRUE
#> 5      S1     1   control    1750    NA   response                TRUE
#> 6      S1     1   control    2250   3.2   recovery                TRUE
#>   .gp3_phase_window_start .gp3_phase_window_end
#> 1                       0                   500
#> 2                       0                   500
#> 3                     500                  1500
#> 4                     500                  1500
#> 5                    1500                  2000
#> 6                    2000                  2500
The helper records whether each row was assigned to a declared phase.
Summarise phase coverage
summarize_gazepoint_phase_coverage() summarises row
counts, timing, and optional complete-value coverage by phase and
group.
phase_coverage <- summarize_gazepoint_phase_coverage(
  segmented,
  phase_col = "task_phase",
  group_cols = c("subject", "condition"),
  time_col = "time_ms",
  value_cols = "pupil"
)

phase_coverage
#>       group_id    phase n_rows n_finite_time min_time max_time time_span
#> 1   S1.control baseline      4             4        0      250       250
#> 2   S1.control recovery      2             2     2250     2250         0
#> 3   S1.control response      2             2     1750     1750         0
#> 4   S1.control stimulus      4             4      750     1250       500
#> 5 S2.treatment baseline      4             4        0      250       250
#> 6 S2.treatment recovery      2             2     2250     2250         0
#> 7 S2.treatment response      2             2     1750     1750         0
#> 8 S2.treatment stimulus      4             4      750     1250       500
#>   n_complete_value_rows complete_value_rate n_any_value_missing
#> 1                     4                1.00                   0
#> 2                     2                1.00                   0
#> 3                     1                0.50                   1
#> 4                     4                1.00                   0
#> 5                     3                0.75                   1
#> 6                     2                1.00                   0
#> 7                     2                1.00                   0
#> 8                     3                0.75                   1
#>   any_value_missing_rate
#> 1                   0.00
#> 2                   0.00
#> 3                   0.50
#> 4                   0.00
#> 5                   0.25
#> 6                   0.00
#> 7                   0.00
#> 8                   0.25
The British spelling alias is also available.
summarise_gazepoint_phase_coverage(
  segmented,
  phase_col = "task_phase",
  time_col = "time_ms",
  value_cols = "pupil"
)
#>   group_id    phase n_rows n_finite_time min_time max_time time_span
#> 1      all baseline      8             8        0      250       250
#> 2      all recovery      4             4     2250     2250         0
#> 3      all response      4             4     1750     1750         0
#> 4      all stimulus      8             8      750     1250       500
#>   n_complete_value_rows complete_value_rate n_any_value_missing
#> 1                     7               0.875                   1
#> 2                     4               1.000                   0
#> 3                     3               0.750                   1
#> 4                     7               0.875                   1
#>   any_value_missing_rate
#> 1                  0.125
#> 2                  0.000
#> 3                  0.250
#> 4                  0.125
Plot phase timing
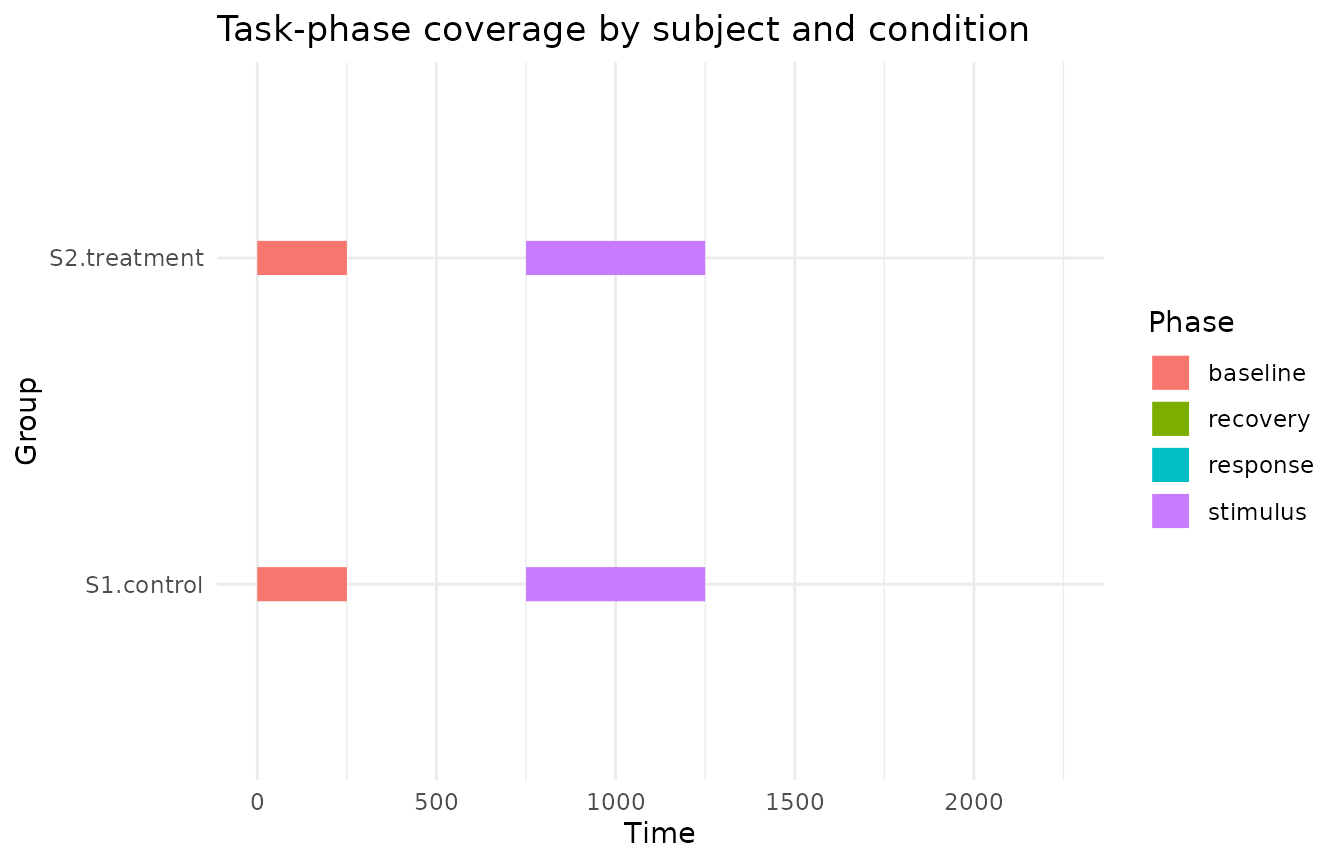
plot_gazepoint_phase_timeline() visualises the timing
coverage of each phase. When timing information is available, it draws
phase intervals by group.
plot_gazepoint_phase_timeline(
  segmented,
  phase_col = "task_phase",
  group_cols = c("subject", "condition"),
  time_col = "time_ms",
  title = "Task-phase coverage by subject and condition"
)
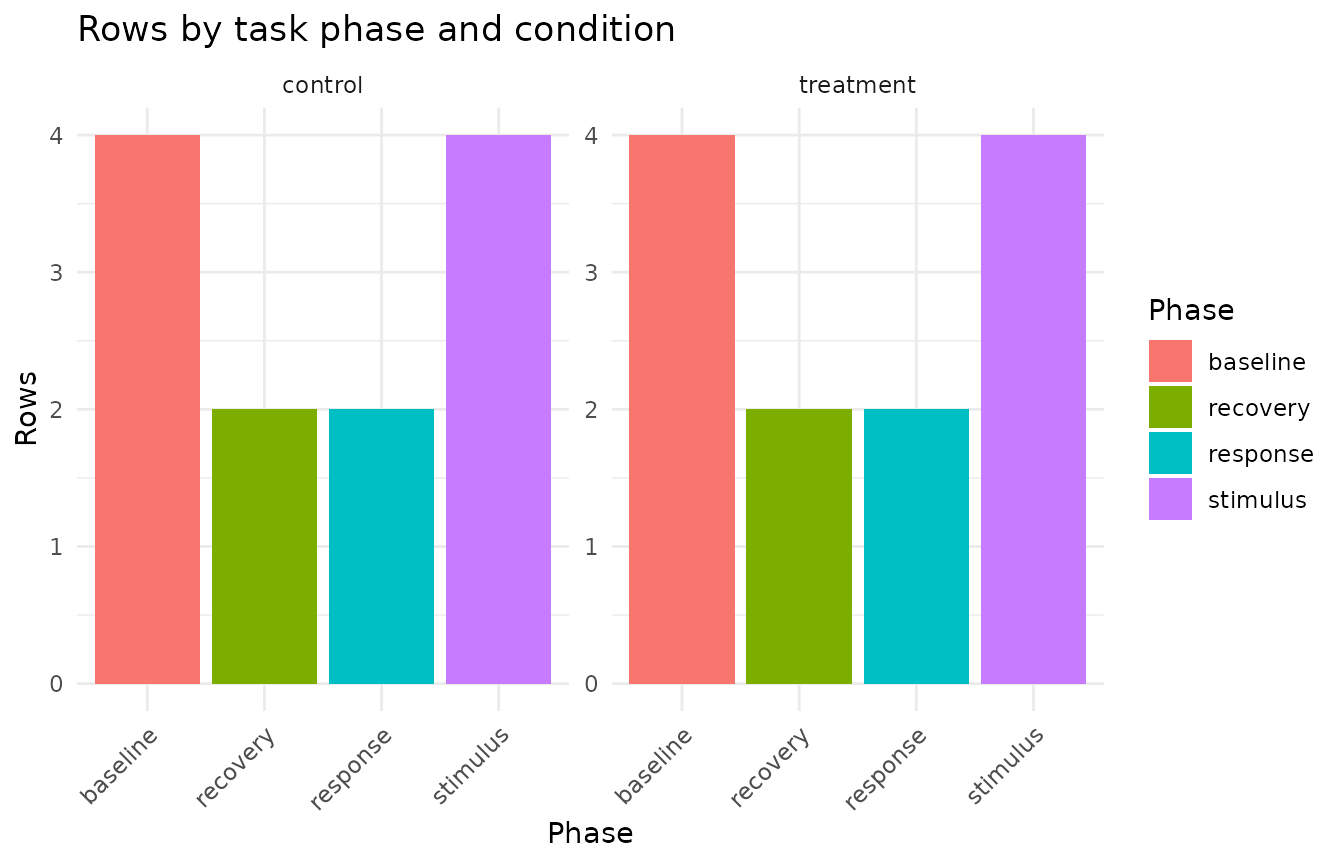
If timing information is not supplied, the same function falls back to a descriptive count plot.
plot_gazepoint_phase_timeline(
  segmented,
  phase_col = "task_phase",
  group_cols = "condition",
  title = "Rows by task phase and condition"
)
Generate cautious report text
report_gazepoint_phase_coverage() returns the summary
table, phase totals, overall diagnostics, and compact report text.
phase_report <- report_gazepoint_phase_coverage(
  phase_coverage,
  digits = 1
)

phase_report$overall
#>   n_phases n_groups total_rows least_represented_phase
#> 1        4        2         24                recovery
#>   least_represented_phase_rows weighted_complete_value_rate
#> 1                            4                        0.875
phase_report$phase_totals
#>      phase n_rows
#> 1 baseline      8
#> 4 stimulus      8
#> 2 recovery      4
#> 3 response      4
phase_report$report_text
#> [1] "Task-phase coverage was summarized across 4 phase(s) and 2 group(s), representing 24 row(s). The least represented phase was 'recovery' with 4 row(s). The weighted complete-value rate across summarized phases was 87.5%. These values are descriptive data-coverage diagnostics and do not by themselves define exclusion decisions."
The generated wording is deliberately cautious. Phase coverage summaries describe data availability within declared task windows; they do not by themselves justify exclusion, imputation, or modelling decisions.
Suggested workflow
A transparent task-phase workflow is:
- Declare phase windows from the experimental protocol.
- Segment samples using the declared timing table.
- Summarise row, timing, and value coverage by participant, trial, condition, or other grouping variables.
- Inspect the phase timeline visually.
- Report coverage diagnostics separately from exclusion decisions.