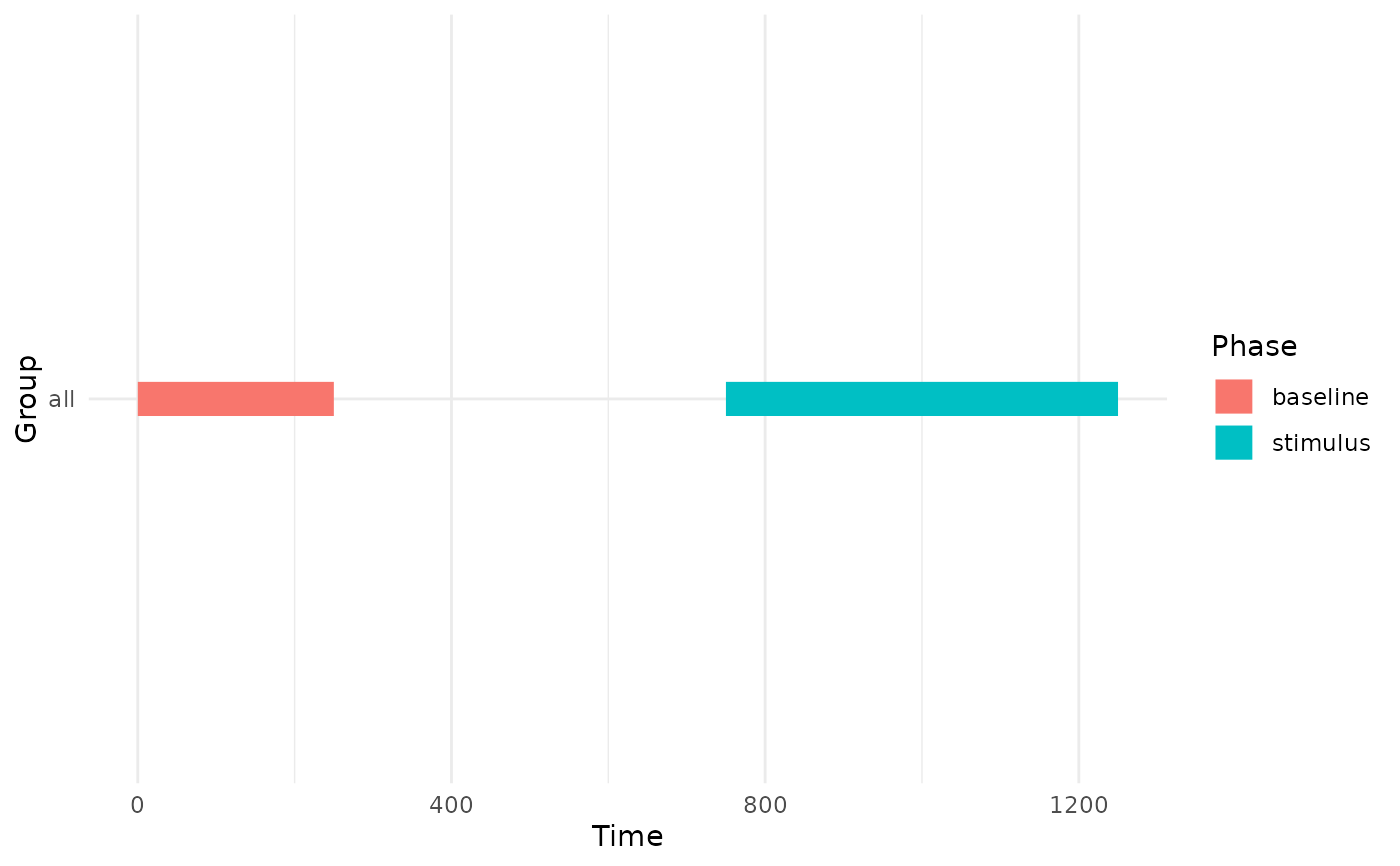
Plot a Gazepoint task-phase timeline
Source:R/phase_segmentation_extensions.R
plot_gazepoint_phase_timeline.RdCreates a descriptive timeline plot from segmented Gazepoint-style data or from a phase-coverage summary. The plot is intended for visual inspection of task-phase coverage and timing, not for inferential analysis.
Usage
plot_gazepoint_phase_timeline(
  data,
  phase_col = "task_phase",
  group_cols = NULL,
  time_col = NULL,
  title = NULL
)
Arguments
- data
A segmented data frame or a summary produced by
summarize_gazepoint_phase_coverage().- phase_col
Character name of the phase column when
datais raw data.- group_cols
Optional grouping columns when
datais raw data.- time_col
Optional time column when
datais raw data.- title
Optional plot title.
Examples
x <- data.frame(time_ms = c(0, 250, 750, 1250))
windows <- data.frame(
  phase = c("baseline", "stimulus"),
  start = c(0, 500),
  end = c(500, 1500)
)
segmented <- segment_gazepoint_task_phases(x, "time_ms", windows)
plot_gazepoint_phase_timeline(segmented, time_col = "time_ms")