Binocular Pupil Fusion and Downsampling
Source:vignettes/articles/binocular-pupil-processing.Rmd
binocular-pupil-processing.RmdPurpose
This article demonstrates three lightweight binocular pupil operations:
- sample-wise left/right averaging;
- cross-eye regression as a diagnostic smoothing and fusion method;
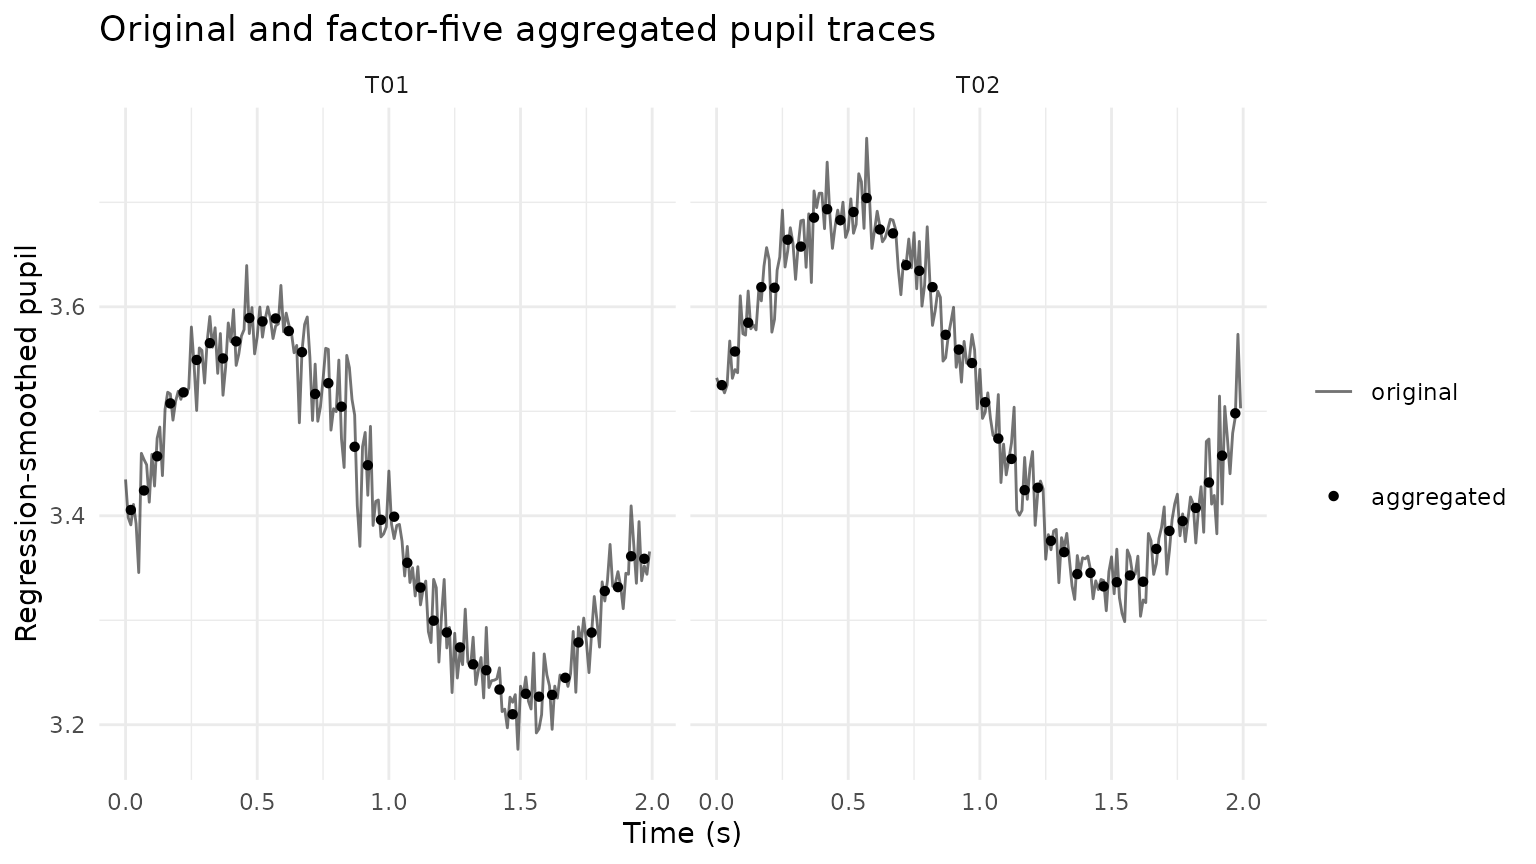
- integer-factor aggregation for lower-frequency analysis tables.
Regression-based fusion is a preprocessing device, not a causal model. It should be compared with the simple binocular mean and inspected visually.
Simulate binocular pupil measurements
set.seed(2026)

n <- 400
pupil <- data.frame(
  USER_ID = "P01",
  trial = rep(c("T01", "T02"), each = n / 2),
  TIME = rep(seq(0, 1.99, by = 0.01), 2)
)

latent <- 3.4 +
  0.20 * sin(2 * pi * pupil$TIME / 2) +
  ifelse(pupil$trial == "T02", 0.12, 0)

pupil$LPupil <- latent + rnorm(n, 0, 0.035)
pupil$RPupil <- 0.10 + 0.97 * latent + rnorm(n, 0, 0.045)

pupil$LPupil[85:90] <- NA_real_
pupil$RPupil[250:255] <- NA_real_
Mean binocular pupil
pupil_mean <- mean_gazepoint_pupil(
  pupil,
  lp_col = "LPupil",
  rp_col = "RPupil"
)

head(pupil_mean)
#>   USER_ID trial TIME   LPupil   RPupil mean_pupil
#> 1     P01   T01 0.00 3.418221 3.458160   3.438190
#> 2     P01   T01 0.01 3.368493 3.428966   3.398729
#> 3     P01   T01 0.02 3.417431 3.362638   3.390035
#> 4     P01   T01 0.03 3.415855 3.407699   3.411777
#> 5     P01   T01 0.04 3.401734 3.381400   3.391567
#> 6     P01   T01 0.05 3.343224 3.338307   3.340765
Regression-smoothed binocular trace
pupil_regressed <- regress_gazepoint_pupils(
  pupil_mean,
  lp_col = "LPupil",
  rp_col = "RPupil",
  group_cols = "trial",
  direction = "bidirectional",
  min_complete = 20
)

ggplot(pupil_regressed, aes(TIME)) +
  geom_line(aes(y = mean_pupil, linetype = "binocular mean")) +
  geom_line(
    aes(y = pupil_regressed, linetype = "regression-smoothed")
  ) +
  facet_wrap(~ trial) +
  labs(
    x = "Time (s)",
    y = "Pupil size",
    linetype = NULL,
    title = "Simple mean and bidirectional regression fusion"
  ) +
  theme_minimal()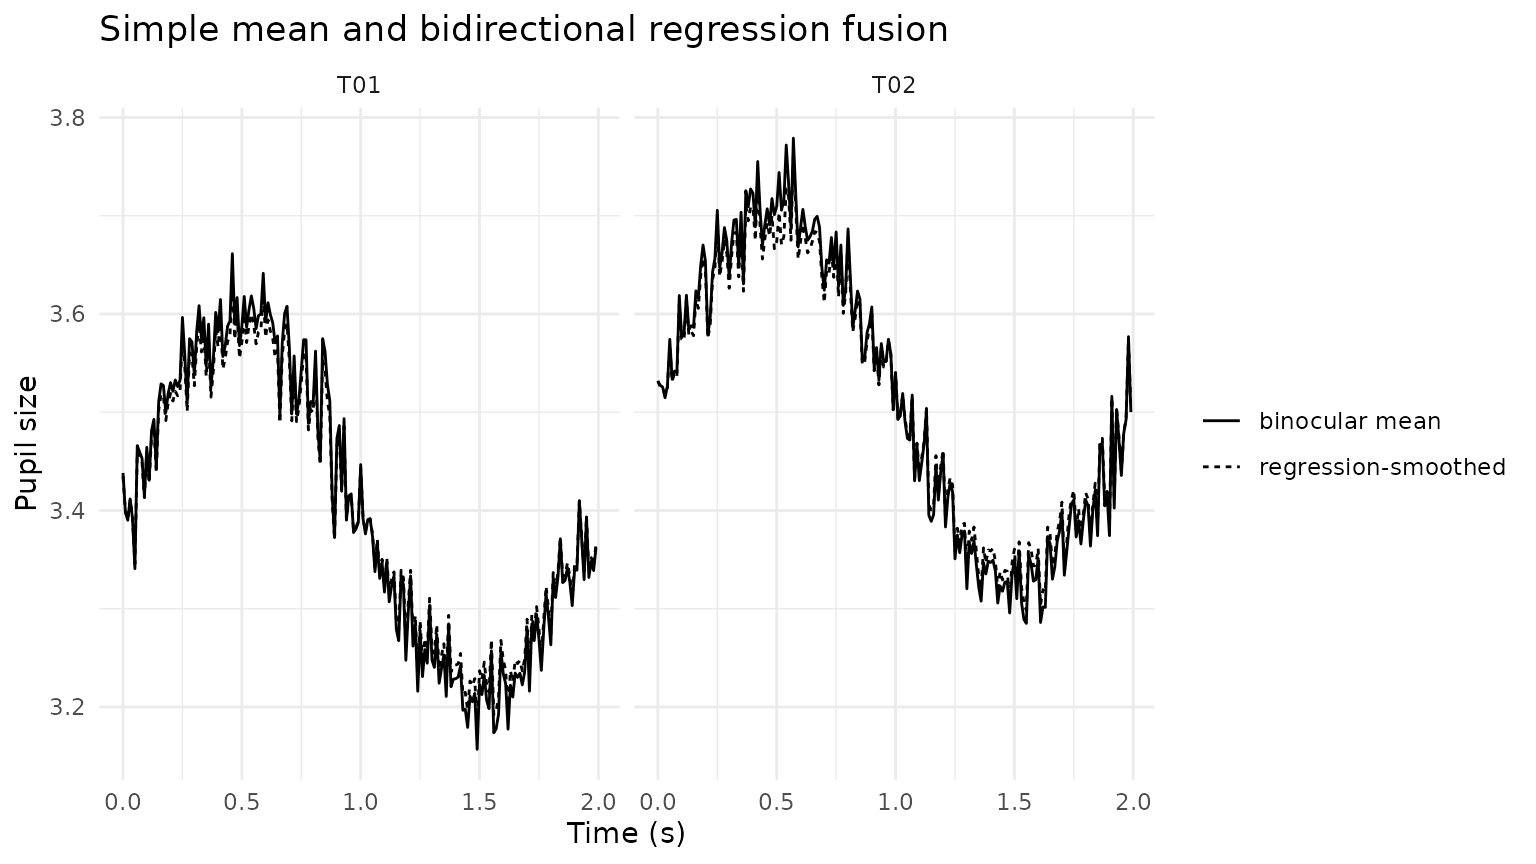
Downsample by aggregation
downsampled <- downsample_gazepoint_pupil(
  pupil_regressed,
  factor = 5,
  pupil_cols = c("mean_pupil", "pupil_regressed"),
  group_cols = "trial",
  method = "mean"
)

downsampled[c(
  "USER_ID", "trial", "TIME", "mean_pupil",
  "pupil_regressed", "n_samples_aggregated"
)]
#>    USER_ID trial TIME mean_pupil pupil_regressed n_samples_aggregated
#> 1      P01   T01 0.02   3.406060        3.405537                    5
#> 2      P01   T01 0.07   3.426607        3.424201                    5
#> 3      P01   T01 0.12   3.462294        3.456954                    5
#> 4      P01   T01 0.17   3.517100        3.507570                    5
#> 5      P01   T01 0.22   3.528636        3.518122                    5
#> 6      P01   T01 0.27   3.561813        3.549142                    5
#> 7      P01   T01 0.32   3.580049        3.565231                    5
#> 8      P01   T01 0.37   3.563482        3.550576                    5
#> 9      P01   T01 0.42   3.581730        3.566917                    5
#> 10     P01   T01 0.47   3.605743        3.589242                    5
#> 11     P01   T01 0.52   3.602805        3.586000                    5
#> 12     P01   T01 0.57   3.606107        3.588827                    5
#> 13     P01   T01 0.62   3.592798        3.576783                    5
#> 14     P01   T01 0.67   3.570636        3.556598                    5
#> 15     P01   T01 0.72   3.526235        3.516570                    5
#> 16     P01   T01 0.77   3.537948        3.526896                    5
#> 17     P01   T01 0.82   3.515365        3.504422                    5
#> 18     P01   T01 0.87   3.477966        3.466015                    5
#> 19     P01   T01 0.92   3.452920        3.448370                    5
#> 20     P01   T01 0.97   3.395671        3.396116                    5
#> 21     P01   T01 1.02   3.399185        3.399106                    5
#> 22     P01   T01 1.07   3.351154        3.355010                    5
#> 23     P01   T01 1.12   3.325569        3.331277                    5
#> 24     P01   T01 1.17   3.290389        3.299622                    5
#> 25     P01   T01 1.22   3.278119        3.288305                    5
#> 26     P01   T01 1.27   3.262955        3.274031                    5
#> 27     P01   T01 1.32   3.245099        3.257837                    5
#> 28     P01   T01 1.37   3.239445        3.252198                    5
#> 29     P01   T01 1.42   3.219079        3.233713                    5
#> 30     P01   T01 1.47   3.193245        3.210037                    5
#> 31     P01   T01 1.52   3.214488        3.229603                    5
#> 32     P01   T01 1.57   3.211649        3.226858                    5
#> 33     P01   T01 1.62   3.213432        3.228600                    5
#> 34     P01   T01 1.67   3.231430        3.244935                    5
#> 35     P01   T01 1.72   3.268532        3.278790                    5
#> 36     P01   T01 1.77   3.278487        3.288201                    5
#> 37     P01   T01 1.82   3.321847        3.327963                    5
#> 38     P01   T01 1.87   3.325475        3.331715                    5
#> 39     P01   T01 1.92   3.357753        3.361272                    5
#> 40     P01   T01 1.97   3.354897        3.358814                    5
#> 41     P01   T02 0.02   3.525127        3.525016                    5
#> 42     P01   T02 0.07   3.561779        3.557225                    5
#> 43     P01   T02 0.12   3.589581        3.584771                    5
#> 44     P01   T02 0.17   3.629075        3.618805                    5
#> 45     P01   T02 0.22   3.625470        3.618239                    5
#> 46     P01   T02 0.27   3.675440        3.664186                    5
#> 47     P01   T02 0.32   3.669991        3.657636                    5
#> 48     P01   T02 0.37   3.699209        3.685331                    5
#> 49     P01   T02 0.42   3.708360        3.693398                    5
#> 50     P01   T02 0.47   3.701380        3.682958                    5
#> 51     P01   T02 0.52   3.729342        3.690737                    5
#> 52     P01   T02 0.57   3.717891        3.704117                    5
#> 53     P01   T02 0.62   3.687321        3.674037                    5
#> 54     P01   T02 0.67   3.683062        3.670281                    5
#> 55     P01   T02 0.72   3.651660        3.639844                    5
#> 56     P01   T02 0.77   3.643433        3.634425                    5
#> 57     P01   T02 0.82   3.627110        3.618820                    5
#> 58     P01   T02 0.87   3.578635        3.573191                    5
#> 59     P01   T02 0.92   3.564069        3.559027                    5
#> 60     P01   T02 0.97   3.548015        3.546169                    5
#> 61     P01   T02 1.02   3.507681        3.508686                    5
#> 62     P01   T02 1.07   3.471854        3.473871                    5
#> 63     P01   T02 1.12   3.448815        3.454421                    5
#> 64     P01   T02 1.17   3.415969        3.424549                    5
#> 65     P01   T02 1.22   3.420349        3.426825                    5
#> 66     P01   T02 1.27   3.367567        3.376044                    5
#> 67     P01   T02 1.32   3.351691        3.365217                    5
#> 68     P01   T02 1.37   3.332046        3.344191                    5
#> 69     P01   T02 1.42   3.332714        3.345344                    5
#> 70     P01   T02 1.47   3.320529        3.332392                    5
#> 71     P01   T02 1.52   3.322918        3.336429                    5
#> 72     P01   T02 1.57   3.328608        3.342867                    5
#> 73     P01   T02 1.62   3.322809        3.336897                    5
#> 74     P01   T02 1.67   3.357324        3.368255                    5
#> 75     P01   T02 1.72   3.376063        3.385486                    5
#> 76     P01   T02 1.77   3.385886        3.394967                    5
#> 77     P01   T02 1.82   3.400034        3.407483                    5
#> 78     P01   T02 1.87   3.426062        3.431870                    5
#> 79     P01   T02 1.92   3.453486        3.457513                    5
#> 80     P01   T02 1.97   3.496755        3.498066                    5
ggplot() +
  geom_line(
    data = pupil_regressed,
    aes(TIME, pupil_regressed, linetype = "original"),
    alpha = 0.55
  ) +
  geom_point(
    data = downsampled,
    aes(TIME, pupil_regressed, shape = "aggregated"),
    size = 1.5
  ) +
  facet_wrap(~ trial) +
  labs(
    x = "Time (s)",
    y = "Regression-smoothed pupil",
    linetype = NULL,
    shape = NULL,
    title = "Original and factor-five aggregated pupil traces"
  ) +
  theme_minimal()