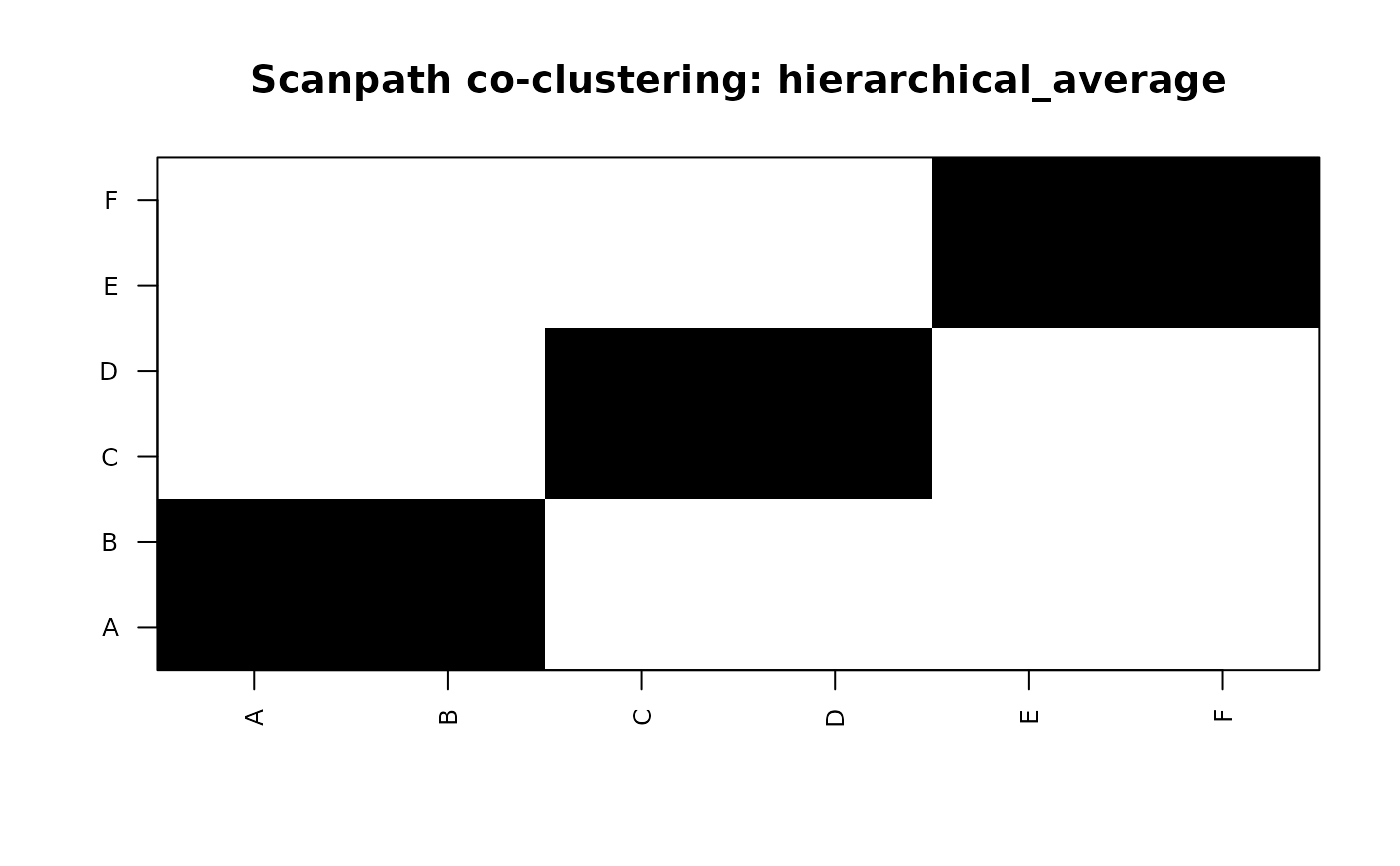
Plot scanpath-cluster stability
Source:R/scanpath_cluster_stability.R
plot_gazepoint_scanpath_cluster_stability.RdCreate base-R diagnostics for co-clustering probabilities, iteration-level adjusted Rand indices, or sequence-level stability.
Usage
plot_gazepoint_scanpath_cluster_stability(
  x,
  plot = c("coclustering", "ari", "sequence"),
  specification = NULL,
  min_pair_coverage = 0.5,
  stable_threshold = 0.75,
  main = NULL,
  label_cex = 0.8
)
Arguments
- x
An object returned by
bootstrap_gazepoint_scanpath_clusters().- plot
Plot type:
"coclustering","ari", or"sequence".- specification
Optional specification name. The first specification is used by default.
- min_pair_coverage
Pair-coverage threshold used in sequence summaries.
- stable_threshold
Stability threshold used in sequence summaries.
- main
Optional plot title.
- label_cex
Axis-label size multiplier.
Examples
latent <- rep(1:3, each = 2)
d <- outer(
  latent,
  latent,
  FUN = function(x, y) ifelse(x == y, 0.1, 1)
)
diag(d) <- 0
dimnames(d) <- list(LETTERS[1:6], LETTERS[1:6])

stability <- bootstrap_gazepoint_scanpath_clusters(
  d,
  k = 3,
  n_boot = 10,
  seed = 1
)

plot_gazepoint_scanpath_cluster_stability(
  stability,
  plot = "coclustering"
)