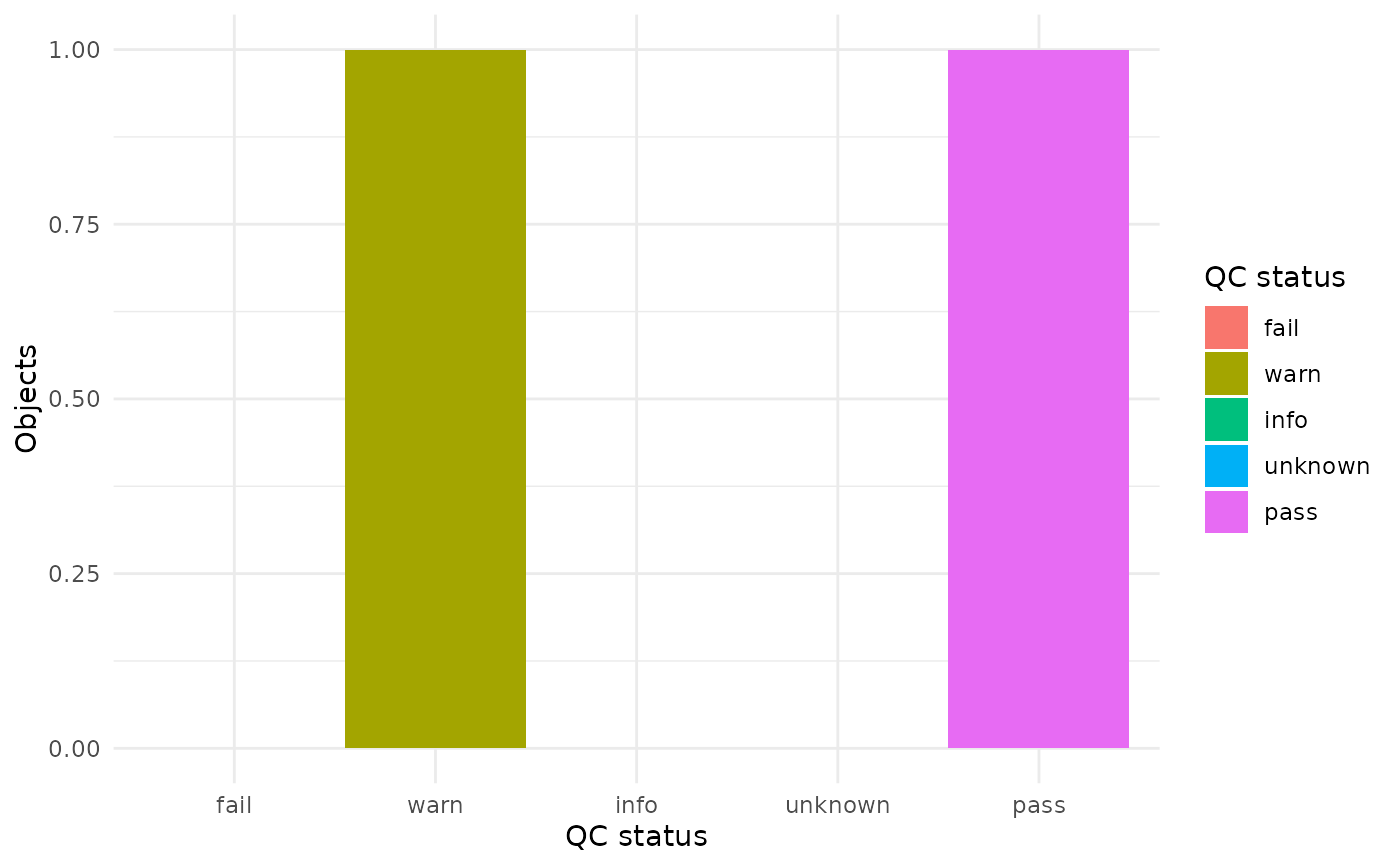
Creates a descriptive QC-status plot from a QC bundle, QC status summary, or
object-summary table produced by collect_gazepoint_qc_summaries(). The plot
is intended for quick review and reporting support; it does not replace the
underlying audit outputs.
Usage
plot_gazepoint_qc_overview(
  qc_bundle,
  plot_type = c("status_counts", "objects"),
  title = NULL
)
Arguments
- qc_bundle
A
gp3_qc_summary_bundle,gp3_qc_status_summary, object-summary data frame, or list of objects that can be passed tocollect_gazepoint_qc_summaries().- plot_type
Either
"status_counts"or"objects".- title
Optional plot title.
Examples
x <- list(
  pass = list(overview = data.frame(audit_status = "ok")),
  warn = list(overview = data.frame(audit_status = "review"))
)
plot_gazepoint_qc_overview(x)