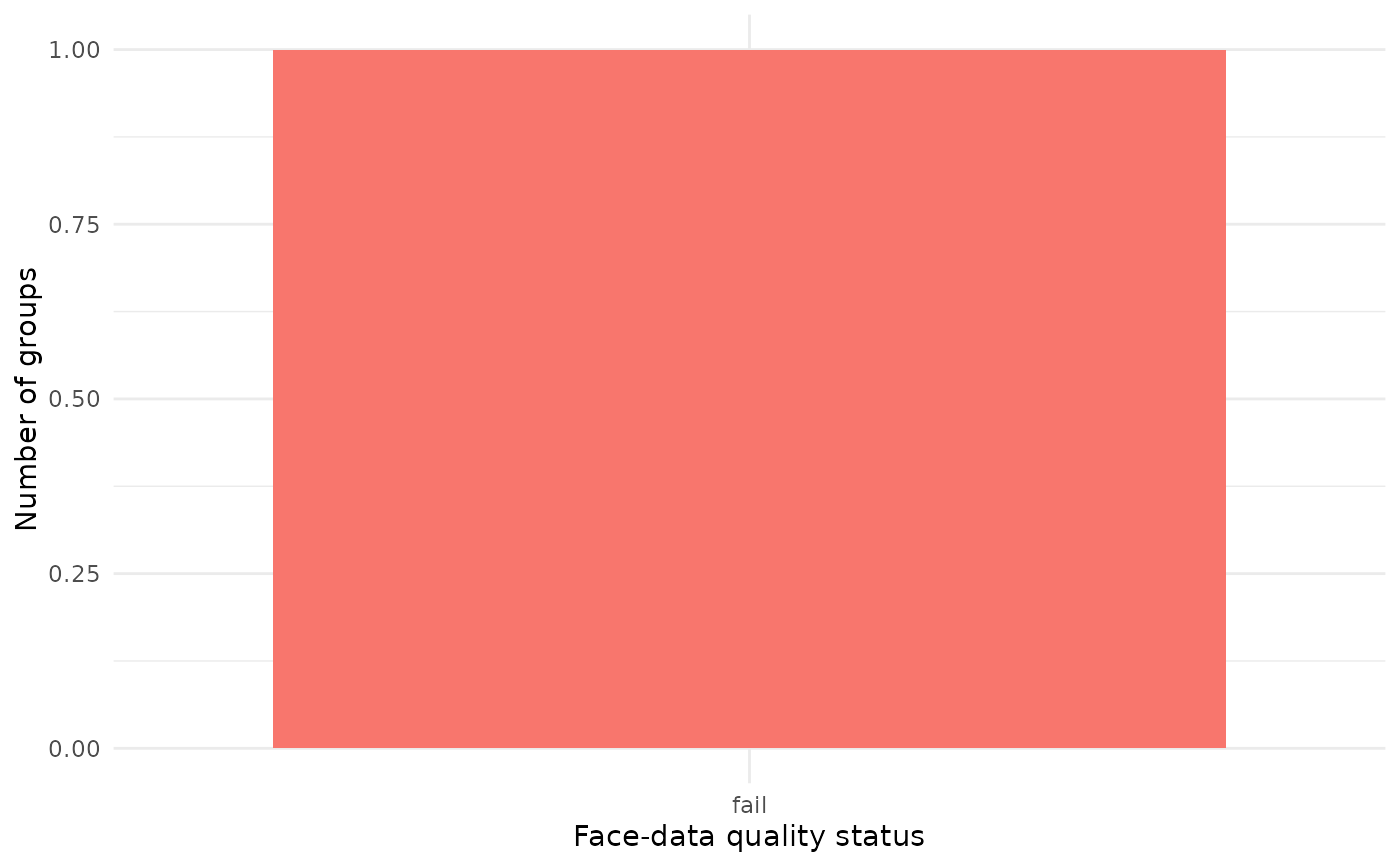
Plot external facial-behaviour data quality
Source:R/face_quality_audit.R
plot_gazepoint_face_quality.RdCreates descriptive quality-control plots from
audit_gazepoint_face_quality() output. The plots summarise face-data
validity, confidence, status, or timing gaps. They do not infer facial
expressions or emotional states.
Usage
plot_gazepoint_face_quality(
  data,
  plot_type = c("status", "validity", "confidence", "time_gaps"),
  group_col = NULL,
  title = NULL,
  ...
)
Arguments
- data
A
gp3_face_quality_auditobject, a standardised face data frame, an unstandardised face data frame, or a CSV path.- plot_type
One of
"status","validity","confidence", or"time_gaps".- group_col
Optional grouping column to use on the y-axis for group-level plots. Defaults to
face_quality_group.- title
Optional plot title.
- ...
Additional arguments passed to
audit_gazepoint_face_quality()whendatais not already an audit object.
Examples
face <- data.frame(
  frame = 1:3,
  timestamp = c(0, 0.033, 0.066),
  confidence = c(0.95, 0.90, 0.40),
  success = c(1, 1, 1)
)

plot_gazepoint_face_quality(face)