This gallery is generated by **gpbiometricspy itself** from bundled synthetic/public demonstration data, with the 0.1.8 PPG measurement-equity tranche adding three deterministic SVG evidence figures alongside the 17 CI-generated PNGs. The figures are not screenshots or hand-drawn mockups.
Current stable documentation for 0.1.8. Documentation CI regenerates the 17 core PNG figures from the checked-out package source. The three PPG measurement-equity SVGs are generated deterministically by `scripts/generate_ppg_equity_synthetic_demo.py` and retained as separate known-truth evidence assets. The former validator marker “Current development documentation.” is retained here only as historical wording; this page now documents the public stable 0.1.8 release.
Use a plot as an evidence checkpoint, then continue into the workflow that produced it. Each route below connects a visual domain to a worked example and to the matching shareable API lens.
Interpretation boundary. A generated plot documents recorded data, processing or an inferential diagnostic. It is not, by itself, evidence of emotion, stress, trust, attention, preference, diagnosis, sensor validity, causal effects or hardware-level synchronization.
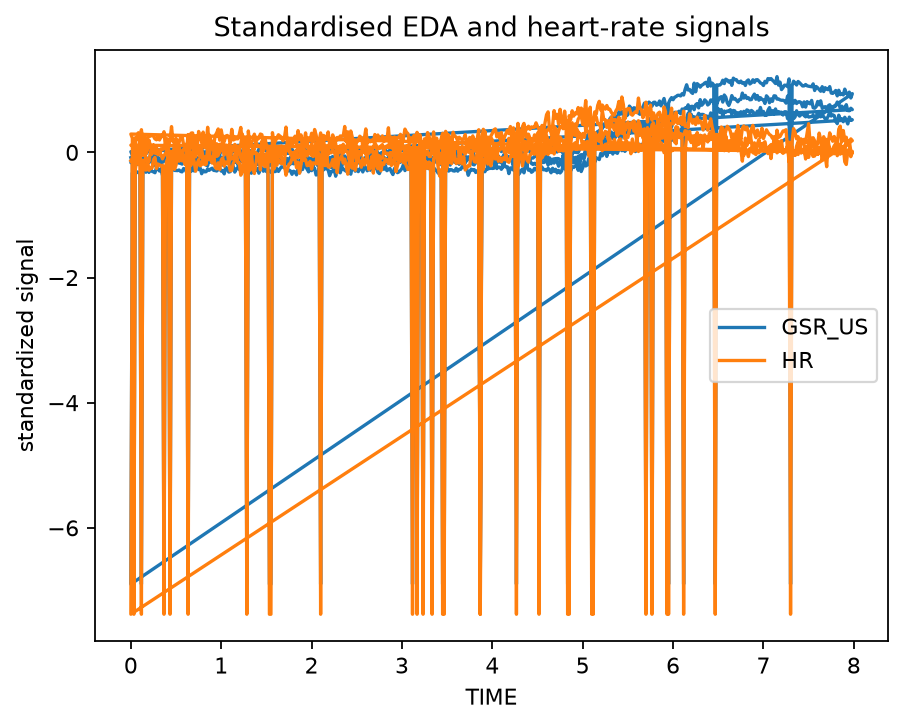
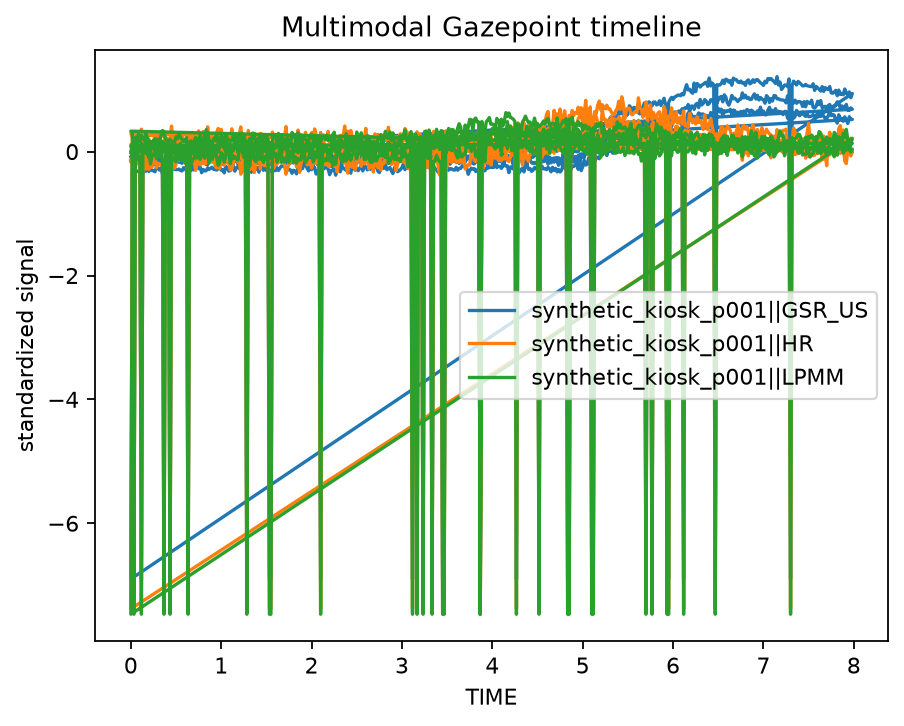
Biometric signal overview. Standardised EDA and heart-rate traces from the bundled kiosk demonstration.Missingness overview. Channel-level availability across EDA, heart-rate, IBI and pupil measurements.Signal-quality diagnostic. A compact core-QC summary suitable for preprocessing review.Biometric quality overview. A broader multi-channel view for manual QC and reporting.
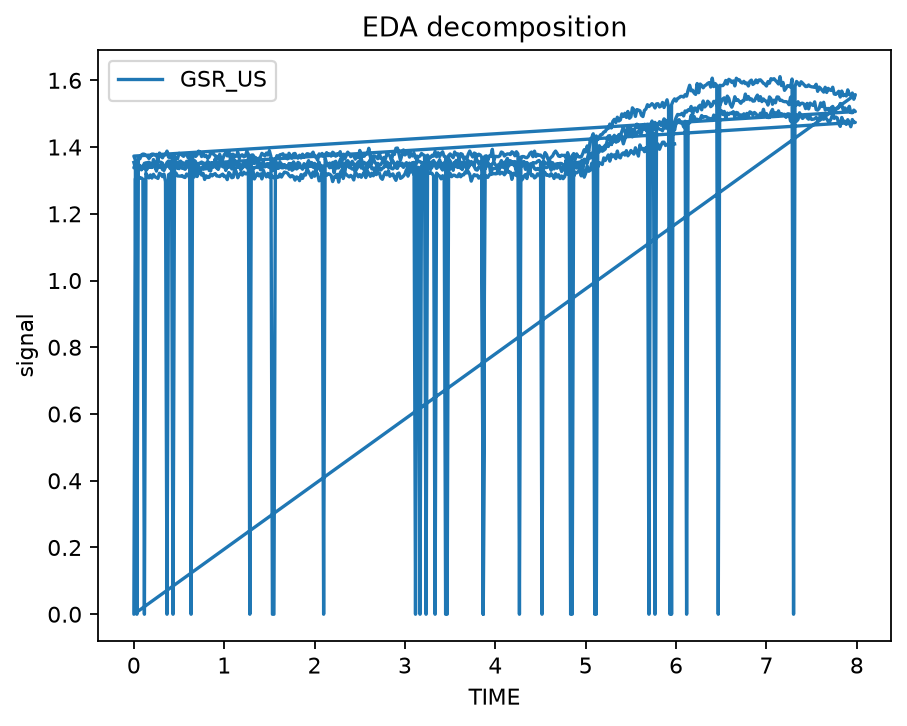
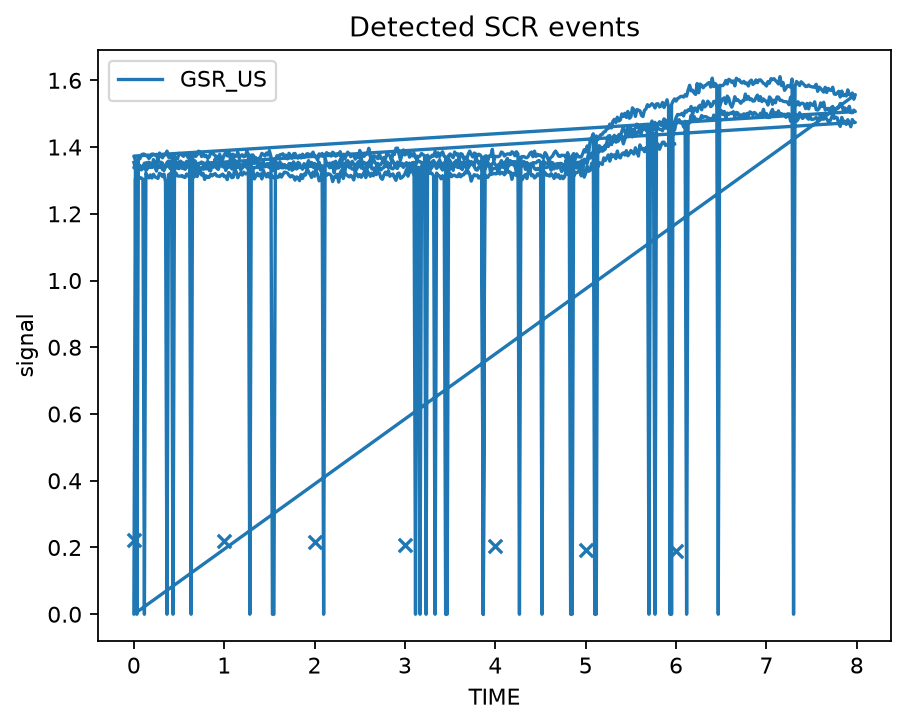
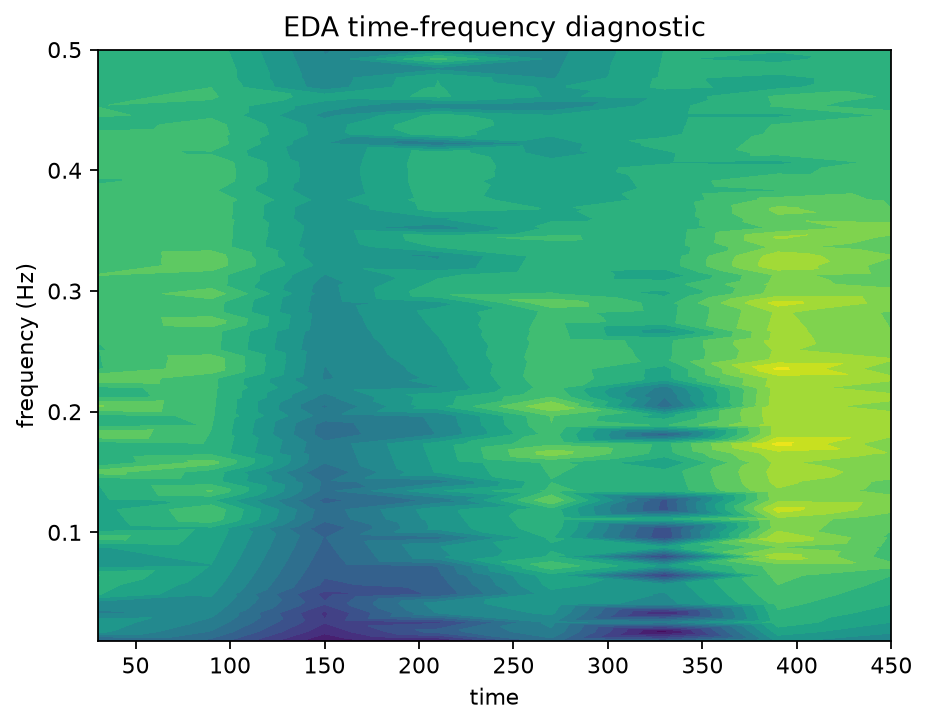
EDA decomposition. Observed signal with tonic and phasic components.SCR events. Deterministically detected skin-conductance responses over the EDA trace.EDA-gram. Time-frequency diagnostic for slow electrodermal dynamics.
See the EDA / SCR example for preprocessing, event detection, QC, and reporting context.
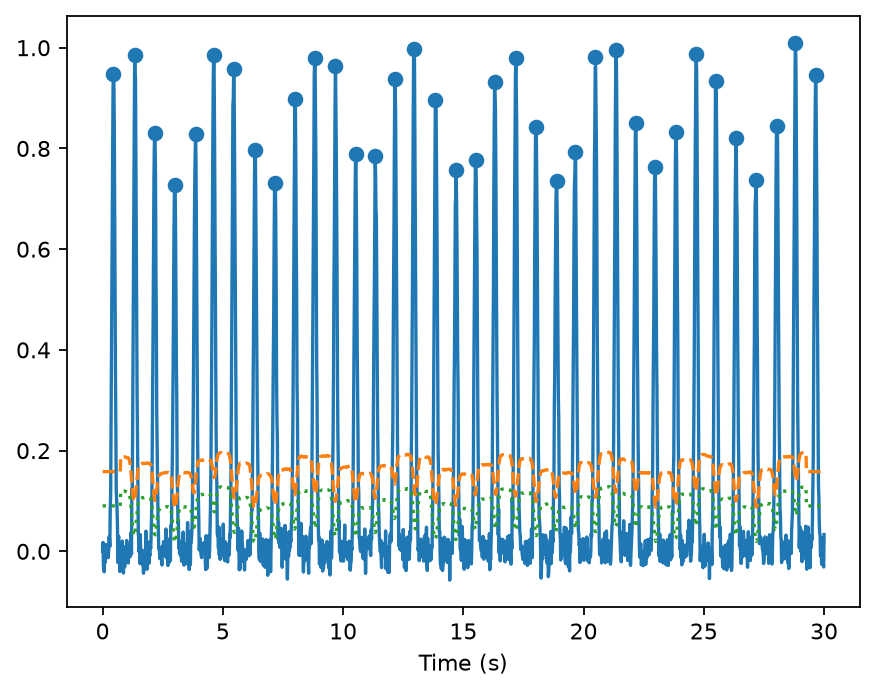
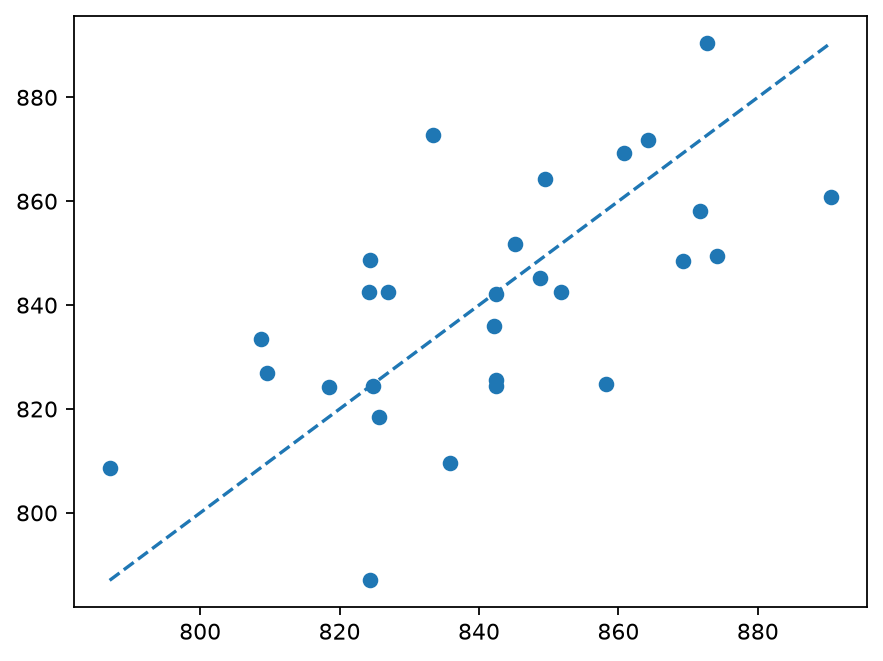
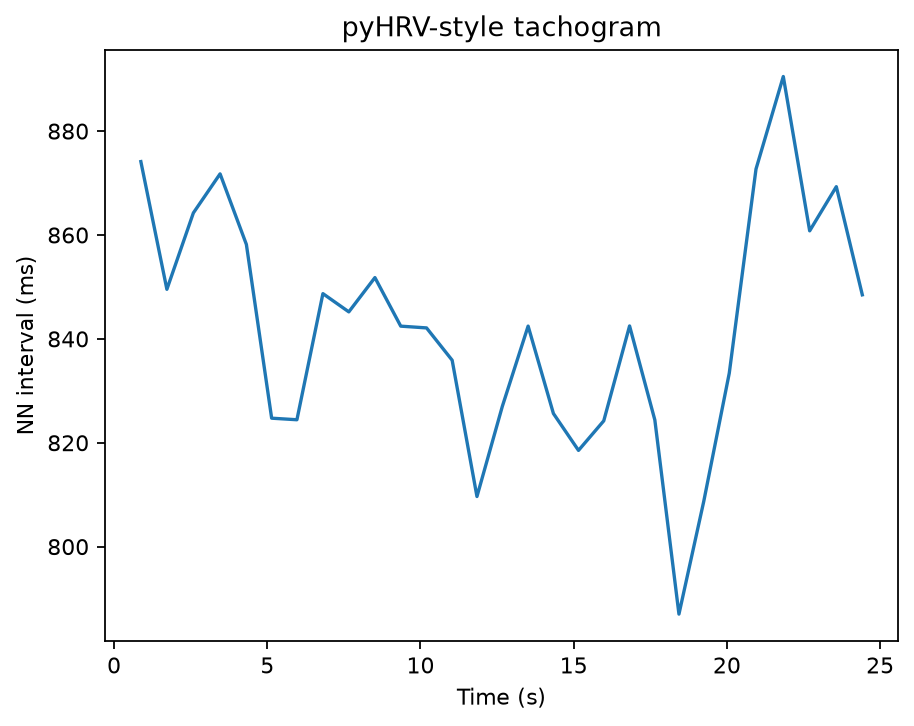
PPG peak detection. Pulse waveform and accepted peaks from the deterministic synthetic generator.Poincaré plot. Beat-to-beat geometry for interval-variability inspection.HRV/PRV-style tachogram. Beat-to-beat interval trajectory through the pyHRV-style visual interface; scientific naming still depends on source provenance.
Use the PPG / HRV example to keep peak detection, interval provenance, and HRV-versus-PRV interpretation explicit.
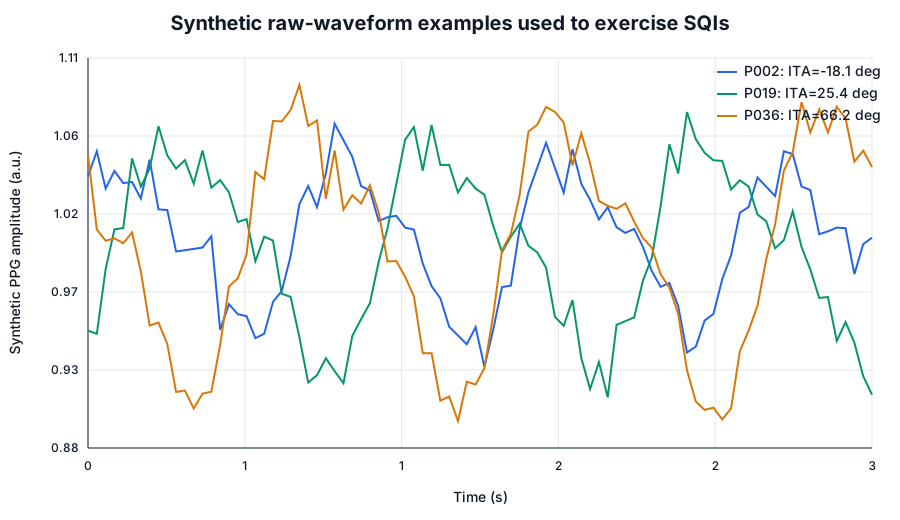
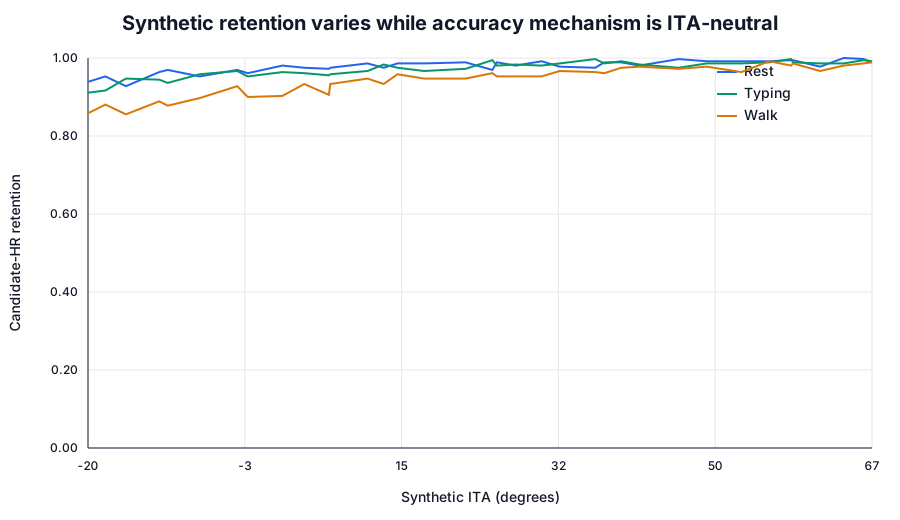
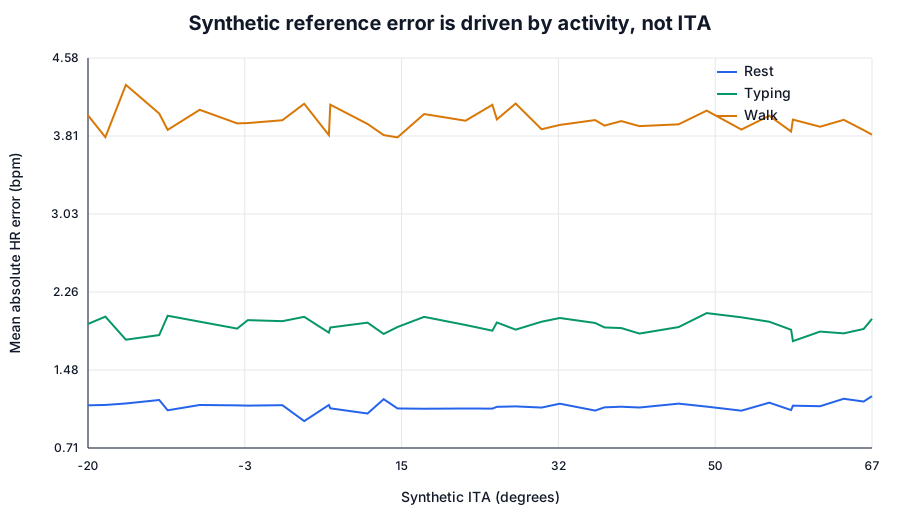
The following three SVG figures are generated by the deterministic PPG measurement-equity example. They deliberately separate waveform properties, candidate-value availability, and reference error.
Raw waveform / SQI evidence. Acquisition-level differences are inspected before downstream agreement claims.Retention over ITA. The known-truth generator makes candidate-HR availability vary across the observed objective-pigmentation range.Reference error over ITA. The synthetic HR-error mechanism remains ITA-neutral even while availability changes.
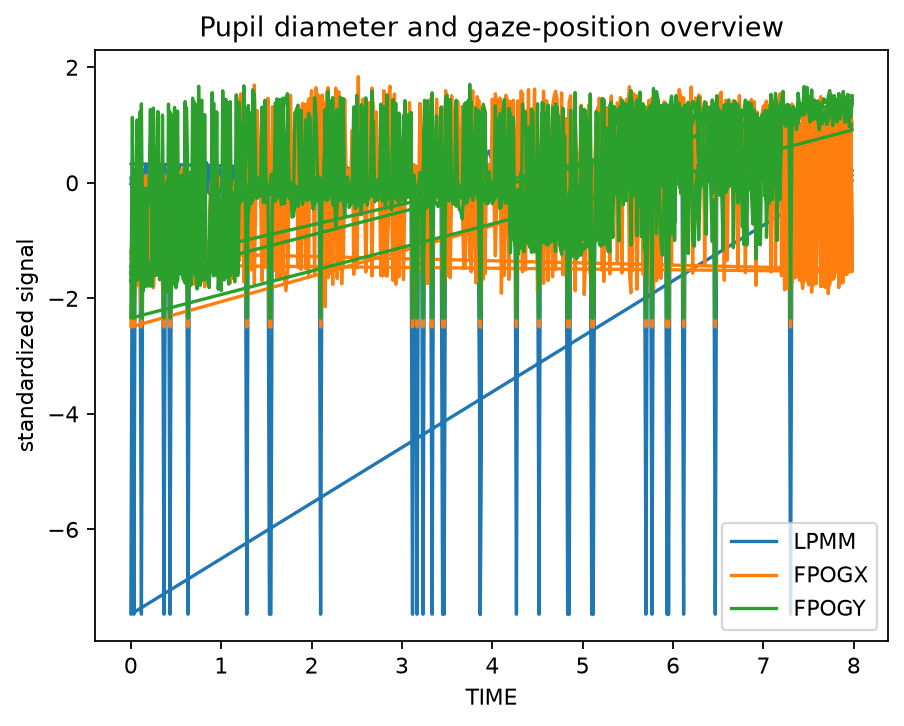
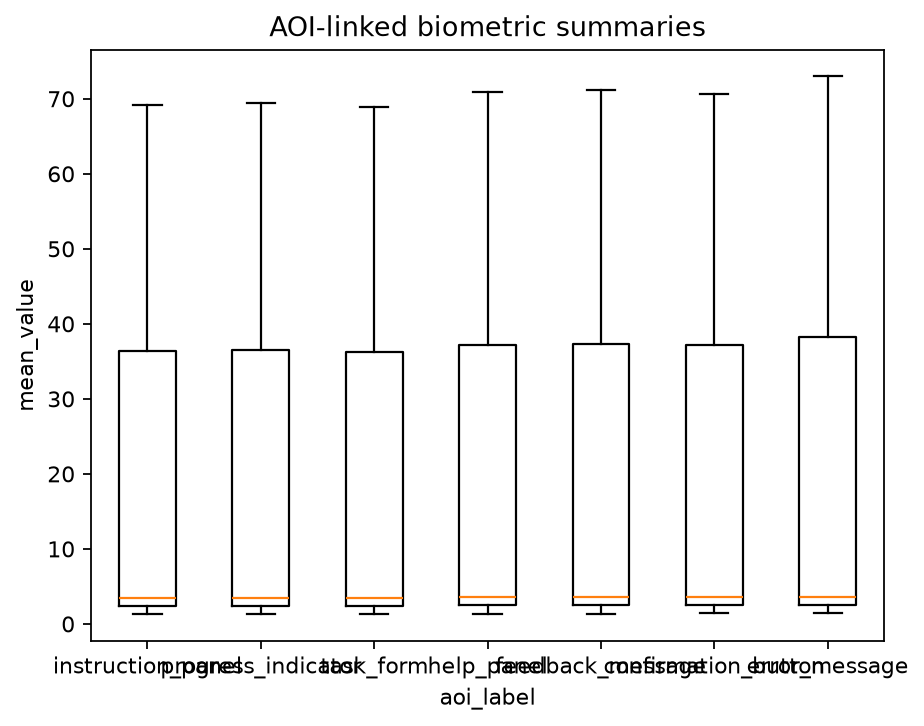
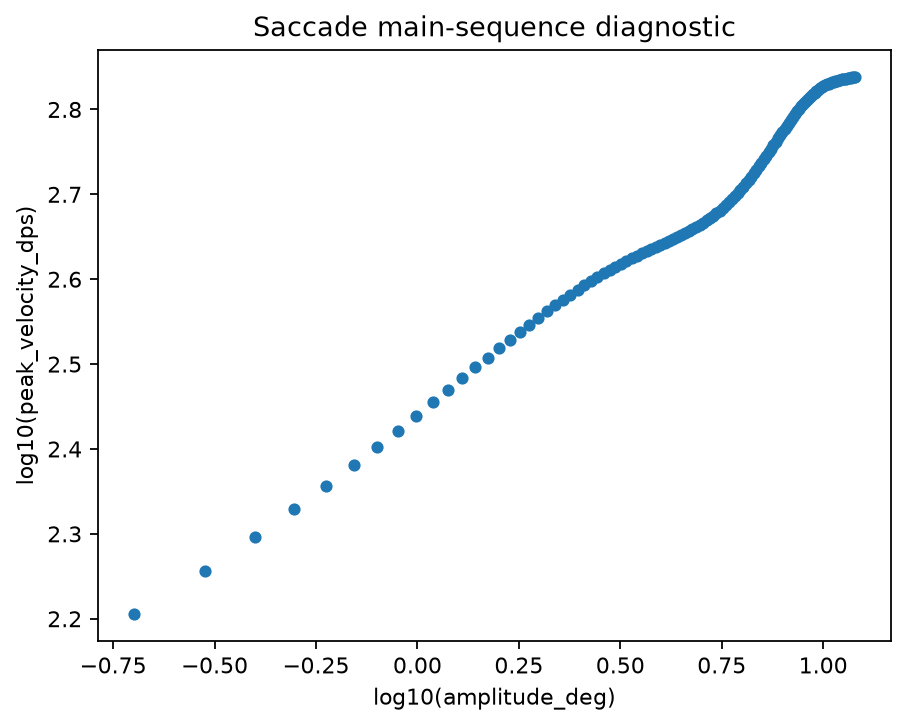
Pupil and gaze overview. Standardised pupil diameter and gaze coordinates for one synthetic participant.AOI-linked biometrics. EDA, heart-rate and pupil summaries grouped by areas of interest.Saccade main sequence. Amplitude/peak-velocity relationship used as a gaze-event diagnostic.
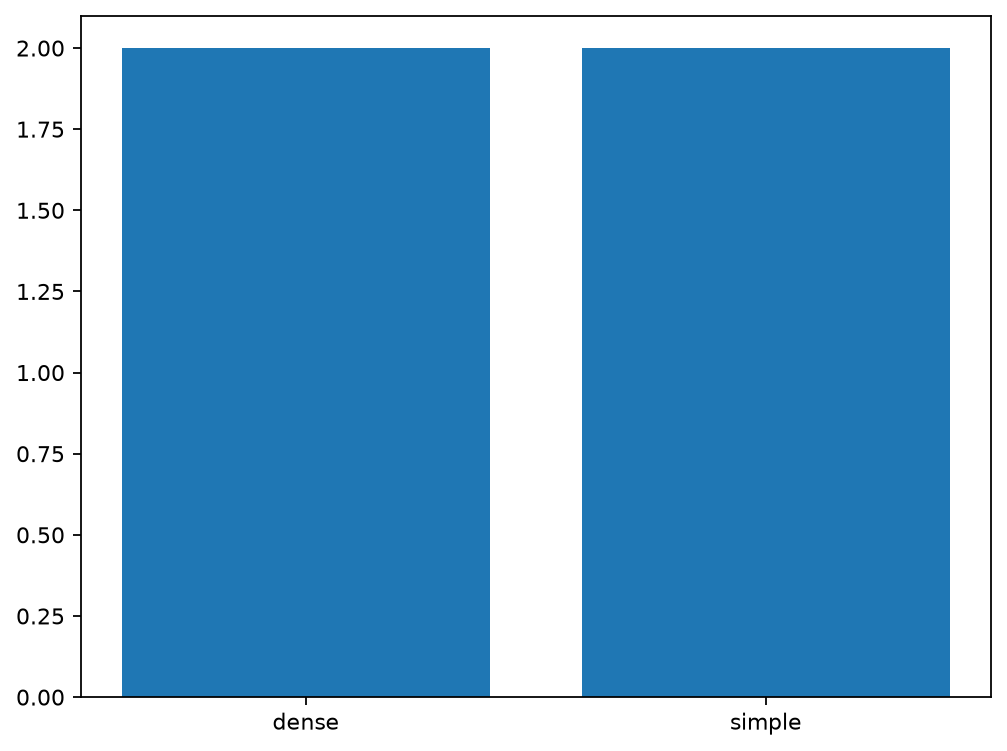
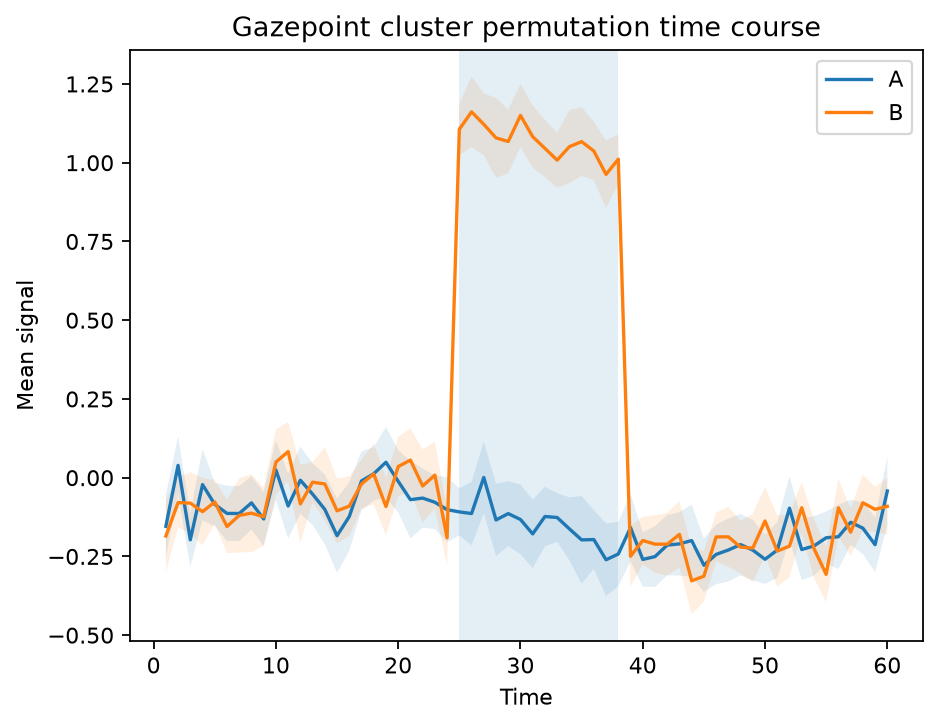
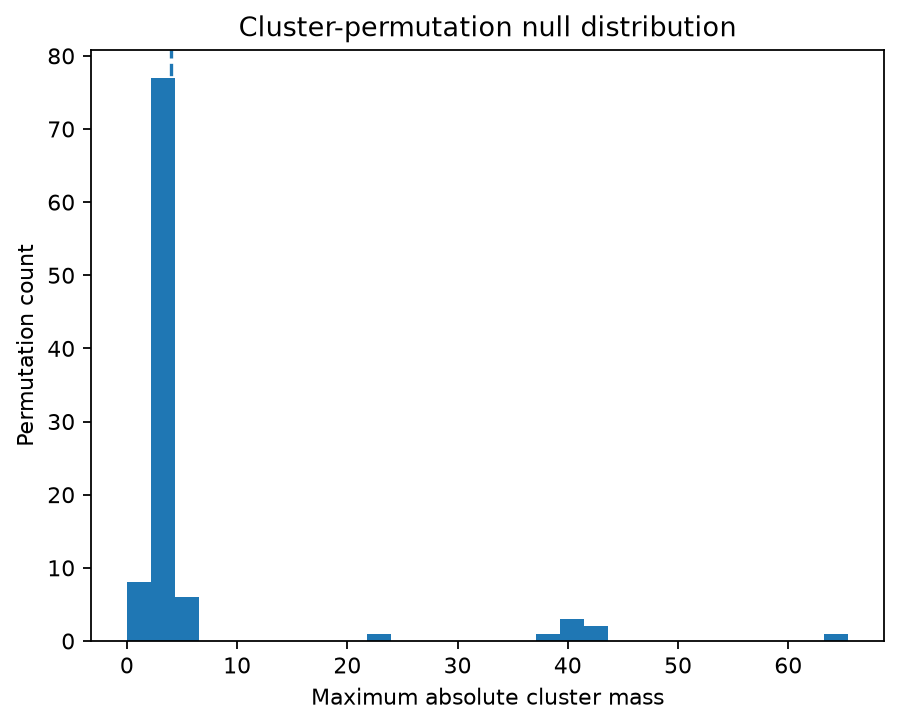
Design coverage. Condition/trial coverage inspected before modelling so sparse or imbalanced cells remain visible.Cluster-permutation time course. A deterministic synthetic two-condition effect with detected cluster information. Cluster timing is descriptive rather than precise onset evidence.Cluster null distribution. The global permutation reference distribution used by the synthetic cluster example.
For model choice, use the modelling strategy guide; for process-data inference, read the relevant method notes before interpreting timing or heterogeneity.