First analysis
1. Install the stable package
For the development line from a checked-out repository, install the editable package instead:
2. Load a deterministic demonstration
import gpbiometricspy as gp

print(gp.__version__)

dat = (
    gp.load_kiosk_demo(participants=["synthetic_kiosk_p001"])
    .copy()
    .iloc[:1800]
    .reset_index(drop=True)
)

print(dat.shape)
print(dat[["TIME", "GSR_US", "HR", "IBI", "LPMM", "FPOGX", "FPOGY"]].head())
The demonstration intentionally contains multiple modalities so you can practice a realistic QC-and-alignment sequence without uploading participant data.
3. Inspect the recorded channels
signals = gp.plot_gazepoint_biometric_signals(
    dat,
    signal_cols=["GSR_US", "HR", "LPMM"],
    time_col="TIME",
    standardize=True,
    main="First-pass signal overview",
)
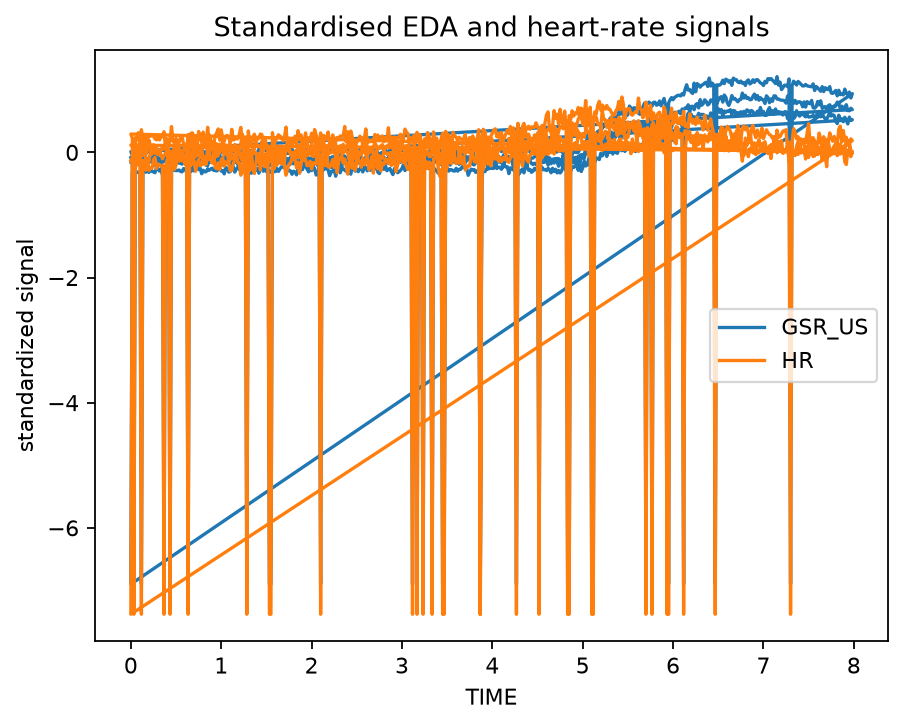
At this stage you are asking whether the channels exist, vary, and are temporally inspectable—not whether they support a substantive psychological interpretation.
4. Make QC explicit
activity = gp.audit_gazepoint_signal_activity(
    dat,
    signal_cols=["GSR_US", "HR", "IBI", "LPMM"],
    group_cols=["participant_id"],
)

resets = gp.audit_gazepoint_time_resets(
    dat,
    time_col="TIME",
    group_cols=["participant_id"],
)

gsr_quality = gp.audit_gazepoint_gsr_quality(
    dat,
    value_column="GSR_US",
)
Useful visual checks include:


5. Follow one modality into analysis
For EDA/SCR:
scr = gp.detect_gazepoint_scr_events(
    dat,
    phasic_col="GSR_US_PHASIC",
    signal_col="GSR_US",
    time_col="TIME",
    group_cols=["participant_id"],
    threshold=0.02,
    min_peak_distance=30,
)

scr_plot = gp.plot_gazepoint_scr_events(
    dat,
    scr["events"],
    time_col="TIME",
    signal_col="GSR_US",
    phasic_col="GSR_US_PHASIC",
    group_cols=["participant_id"],
)
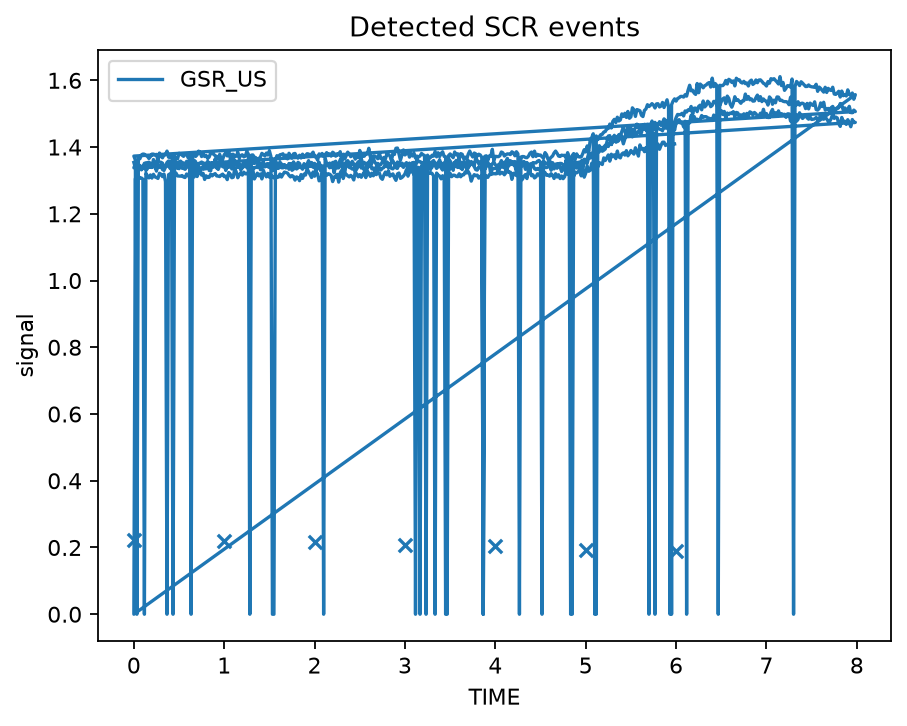
You could instead branch into PPG/HRV, pupil/gaze/AOI, or multimodal alignment.
6. Retain a reproducible evidence bundle
A complete first analysis should leave behind at least:
- the package version;
- the input source and selected participant/session scope;
- the columns and timebase used;
- QC outputs and warnings;
- preprocessing or detection settings;
- generated figures used for inspection;
- derived tables or events;
- any exclusions or fail-closed decisions.
The Reporting and reproducibility guide expands this into a publication-oriented checklist.
7. Know when the tutorial is finished
You are ready to move to your own data when you can answer these questions without guessing:
- Which column is the analysis timebase?
- Which channels are raw, cleaned, derived, or vendor-precomputed?
- Which QC checks must pass before downstream analysis?
- Which grouping variables define participants, trials, items, or sessions?
- Which outputs are measurements, which are diagnostics, and which are model-derived quantities?
- Which scientific interpretations are not justified by the software output alone?
Next step
Open Validate a new dataset before replacing the demonstration data with a research export.