Multimodal event dashboard
Frozen R source: reference/vignettes/articles/multimodal-event-dashboard.Rmd
This page is the Python migration companion for the corresponding gpbiometrics 2.0.0 article. The original R article is retained verbatim in reference/vignettes/; this companion identifies the matching Python API so the scientific workflow can be reproduced without hiding the reference implementation.
Python API crosswalk
The frozen R article calls the following exported functions; all are available under the same names in gpbiometricspy:
gp.align_gazepoint_biometrics_to_ttl(...)gp.create_gazepoint_biometrics_report_tables(...)gp.create_gazepoint_qc_supplement(...)gp.diagnose_gazepoint_sync_drift(...)gp.extract_gazepoint_ttl_events(...)gp.import_gazepoint_event_log(...)gp.match_gazepoint_events_to_biometrics(...)gp.plot_gazepoint_aoi_biometrics(...)gp.plot_gazepoint_multimodal_timeline(...)gp.prepare_gazepoint_aoi_biometrics_model_data(...)gp.prepare_gazepoint_multimodal_model_data(...)gp.summarise_gazepoint_aoi_biometrics(...)gp.summarise_gazepoint_multimodal_windows(...)gp.summarize_gazepoint_eventlocked_multimodal(...)gp.sync_gazepoint_biometrics_with_gaze(...)
import gpbiometricspy as gp

# Example entry point from this workflow
# result = gp.align_gazepoint_biometrics_to_ttl(...)
Interpretation
Use the same conservative physiological interpretation as the R package: derived biometric features are signal-processing outputs and do not directly establish emotion, stress, cognition, preference, health status, or diagnosis.
Executable Python companion
The frozen R call crosswalk above is retained for completeness. The following companion is an executable end-to-end Python workflow using synthetic/public data and the same scientific domain. It is also executed by the test suite.
Run from the repository root:
from __future__ import annotations
from _shared import *
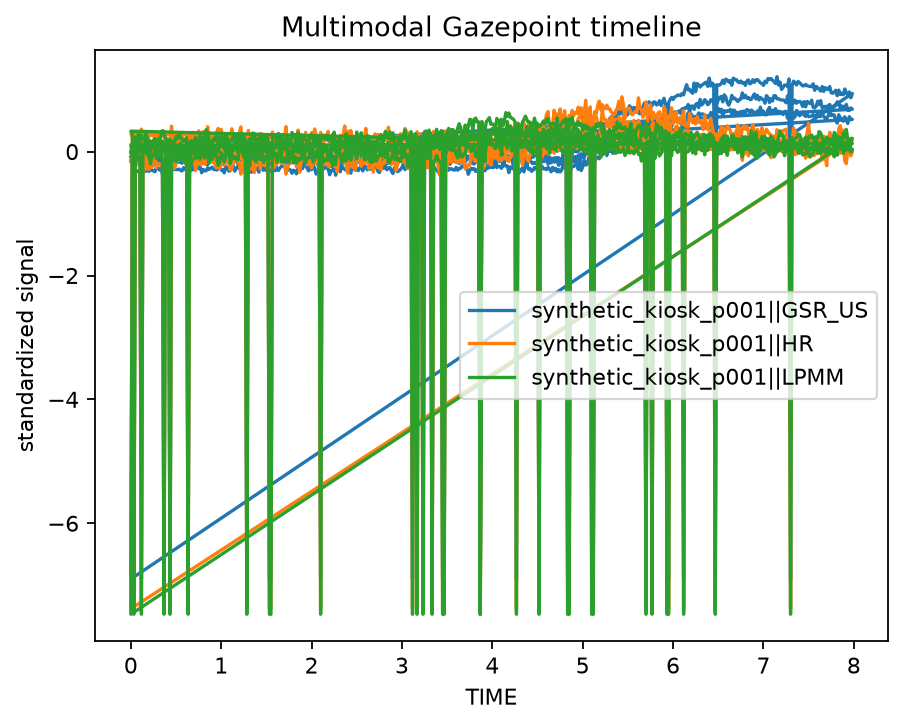
d=demo(900); ev=gp.extract_gazepoint_ttl_events(d,ttl_columns=['TTL0'],group_columns=['participant_id']); summary=gp.summarize_gazepoint_eventlocked_multimodal(d,events=ev,time_col='TIME',event_time_col='TIME',signal_cols=['GSR_US','HR','LPMM'],group_cols=['participant_id']); fig=gp.plot_gazepoint_multimodal_timeline(d,time_col='TIME',signal_cols=['GSR_US','HR','LPMM'],group_cols=['participant_id']); finish('multimodal-event-dashboard',events=ev,summary=summary,figure=fig)
Rendered Python output
These figures are generated from bundled synthetic/public data by scripts/generate_docs_gallery.py using the current Python plotting API.
Multimodal timeline