Plot binocular pupil diagnostics, reconstruction, and sensitivity
Source:R/plot_gazepoint_binocular_diagnostics.R
plot_gazepoint_binocular_diagnostics.RdProvides a compact plotting interface for binocular traces, agreement, Bland-Altman-style differences, artificial-missingness validation, validation residuals, provenance timelines, reconstruction burden, sensitivity summaries, and reconstructed gap durations. Every non-dashboard call returns a ggplot object that can be further customised.
Usage
plot_gazepoint_binocular_diagnostics(
  x,
  type = c("trace", "agreement", "bland_altman", "validation", "residuals", "timeline",
    "burden", "sensitivity", "gaps", "dashboard"),
  left_col = NULL,
  right_col = NULL,
  time_col = NULL,
  prefix = "gp3_binocular",
  point_alpha = 0.35,
  bins = 30L
)
Arguments
- x
A data frame/reconstruction result, or an object produced by
diagnose_gazepoint_binocular_pupil(),validate_gazepoint_binocular_reconstruction(),audit_gazepoint_binocular_reconstruction(), oranalyse_gazepoint_binocular_sensitivity().- type
Plot type:
"trace","agreement","bland_altman","validation","residuals","timeline","burden","sensitivity","gaps", or"dashboard".- left_col, right_col, time_col
Column names for data-frame plots. For reconstruction outputs these are inferred from metadata when omitted.
- prefix
Reconstruction prefix.
- point_alpha
Point transparency for dense scatterplots.
- bins
Histogram bins for
type = "gaps".
Value
A ggplot2 object. type = "dashboard" returns a named list of
ggplot objects rather than introducing a layout dependency.
Examples
dat <- simulate_gazepoint_pupil_data(n_subjects = 3, n_trials = 2, seed = 31)
dat$pupil_left[20:24] <- NA_real_
rec <- reconstruct_gazepoint_binocular_pupil(
  dat, "pupil_left", "pupil_right", time_col = "timestamp_ms",
  group_cols = "subject", min_pairs = 20
)
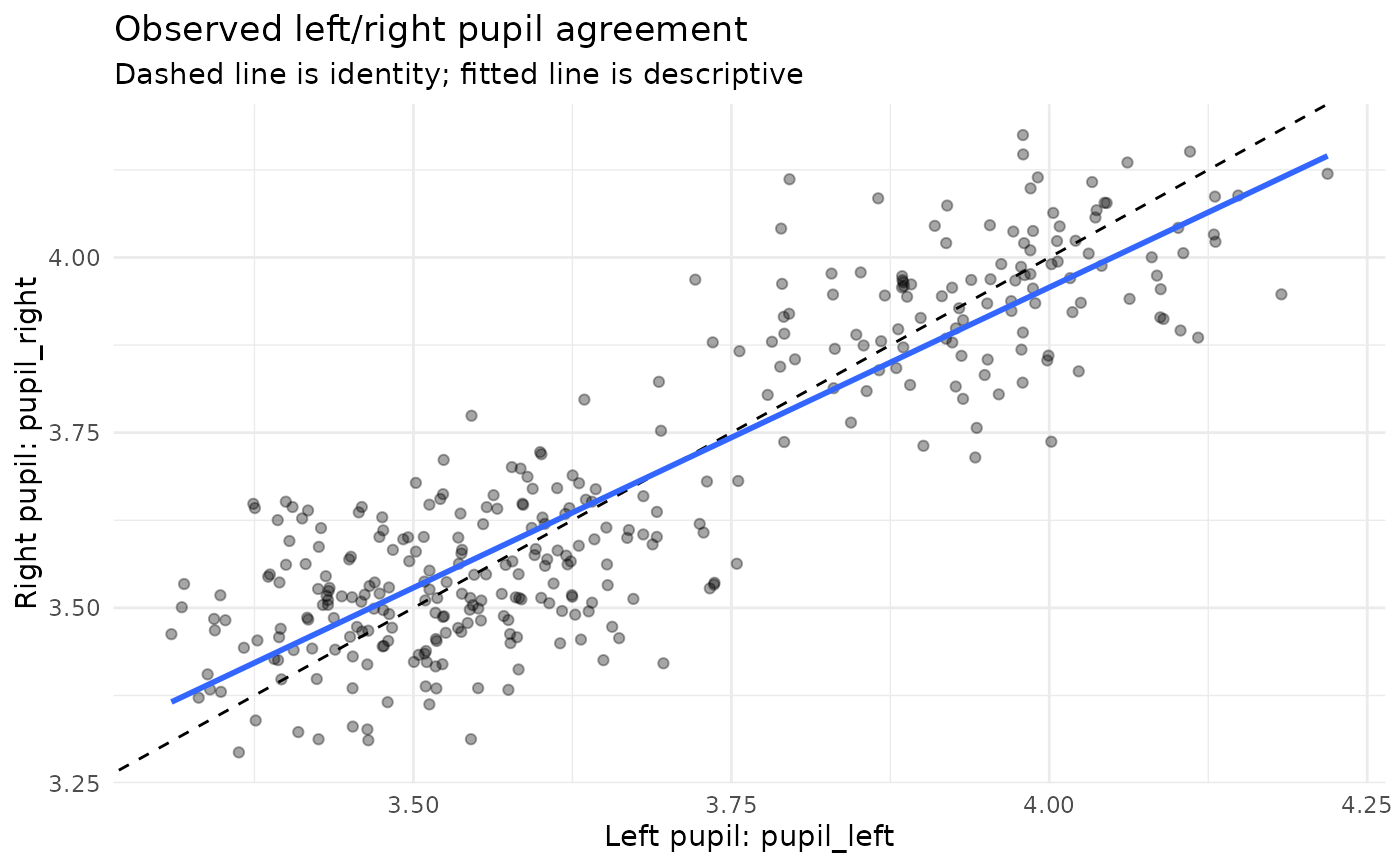
plot_gazepoint_binocular_diagnostics(rec, type = "agreement")