
Design release visual audit
Source:vignettes/articles/design-release-visual-audit.Rmd
design-release-visual-audit.RmdPurpose
This article demonstrates a plot-rich design and release-readiness
audit workflow for gpbiometrics projects.
The workflow is structural and reproducibility-oriented. The figures show condition balance, participant/session coverage, event coverage, export-schema coverage, channel availability, sampling-rate and timebase checks, release-readiness scoring, and compact dashboard-style reporting. These outputs are design, coverage, metadata, timing, quality-control, and release-readiness diagnostics. They should not be interpreted as direct evidence of psychological, clinical, affective, attentional, workload-related, stress-related, autonomic, health-related, or substantive experimental effects.
Synthetic design and export metadata
The example uses synthetic metadata so that the article is reproducible and does not depend on private recordings.
participants <- sprintf("P%02d", 1:24)
sessions <- c("morning", "afternoon")
conditions <- c("simple_clear", "simple_ambiguous", "dense_clear", "dense_ambiguous")
channels <- c("pupil", "gaze", "gsr", "ppg", "hr", "events")

design <- expand.grid(
  participant_id = participants,
  condition = conditions,
  KEEP.OUT.ATTRS = FALSE,
  stringsAsFactors = FALSE
)

design$trial_id <- ave(seq_len(nrow(design)), design$participant_id, FUN = seq_along)
design$session <- rep(rep(sessions, each = length(conditions) / 2), length(participants))
design$expected_events <- 3L
design$observed_events <- design$expected_events - rbinom(nrow(design), 1, 0.04)
design$samples_expected <- 600L
design$samples_observed <- design$samples_expected - rpois(nrow(design), lambda = 8)
design$sampling_rate_hz <- round(rnorm(nrow(design), mean = 60, sd = 0.7), 2)
design$time_reset_flag <- runif(nrow(design)) < 0.025
design$metadata_complete <- runif(nrow(design)) > 0.03

exports <- expand.grid(
  participant_id = participants,
  channel = channels,
  KEEP.OUT.ATTRS = FALSE,
  stringsAsFactors = FALSE
)

exports$file_present <- runif(nrow(exports)) > ifelse(exports$channel == "events", 0.015, 0.035)
exports$schema_valid <- exports$file_present & (runif(nrow(exports)) > 0.025)
exports$channel_active <- exports$file_present & (runif(nrow(exports)) > ifelse(exports$channel %in% c("ppg", "gsr"), 0.045, 0.020))
exports$n_rows <- ifelse(exports$file_present, rpois(nrow(exports), lambda = 2400) + 300, 0L)

head(design)
#>   participant_id    condition trial_id   session expected_events
#> 1            P01 simple_clear        1   morning               3
#> 2            P02 simple_clear        1   morning               3
#> 3            P03 simple_clear        1 afternoon               3
#> 4            P04 simple_clear        1 afternoon               3
#> 5            P05 simple_clear        1   morning               3
#> 6            P06 simple_clear        1   morning               3
#>   observed_events samples_expected samples_observed sampling_rate_hz
#> 1               3              600              589            59.51
#> 2               3              600              593            58.62
#> 3               3              600              589            60.42
#> 4               3              600              592            59.96
#> 5               3              600              592            59.13
#> 6               3              600              593            60.19
#>   time_reset_flag metadata_complete
#> 1           FALSE              TRUE
#> 2           FALSE              TRUE
#> 3           FALSE              TRUE
#> 4           FALSE              TRUE
#> 5           FALSE              TRUE
#> 6           FALSE              TRUE
head(exports)
#>   participant_id channel file_present schema_valid channel_active n_rows
#> 1            P01   pupil         TRUE         TRUE           TRUE   2815
#> 2            P02   pupil         TRUE         TRUE           TRUE   2588
#> 3            P03   pupil         TRUE         TRUE           TRUE   2790
#> 4            P04   pupil         TRUE         TRUE           TRUE   2689
#> 5            P05   pupil         TRUE         TRUE           TRUE   2749
#> 6            P06   pupil         TRUE         TRUE           TRUE   2726
Condition balance
Condition-balance plots check whether the planned design is represented in the working dataset.
condition_counts <- table(design$condition)

barplot(
  condition_counts,
  ylab = "Trial count",
  xlab = "Condition",
  las = 2,
  main = "Condition balance"
)
abline(h = mean(condition_counts), lty = 2)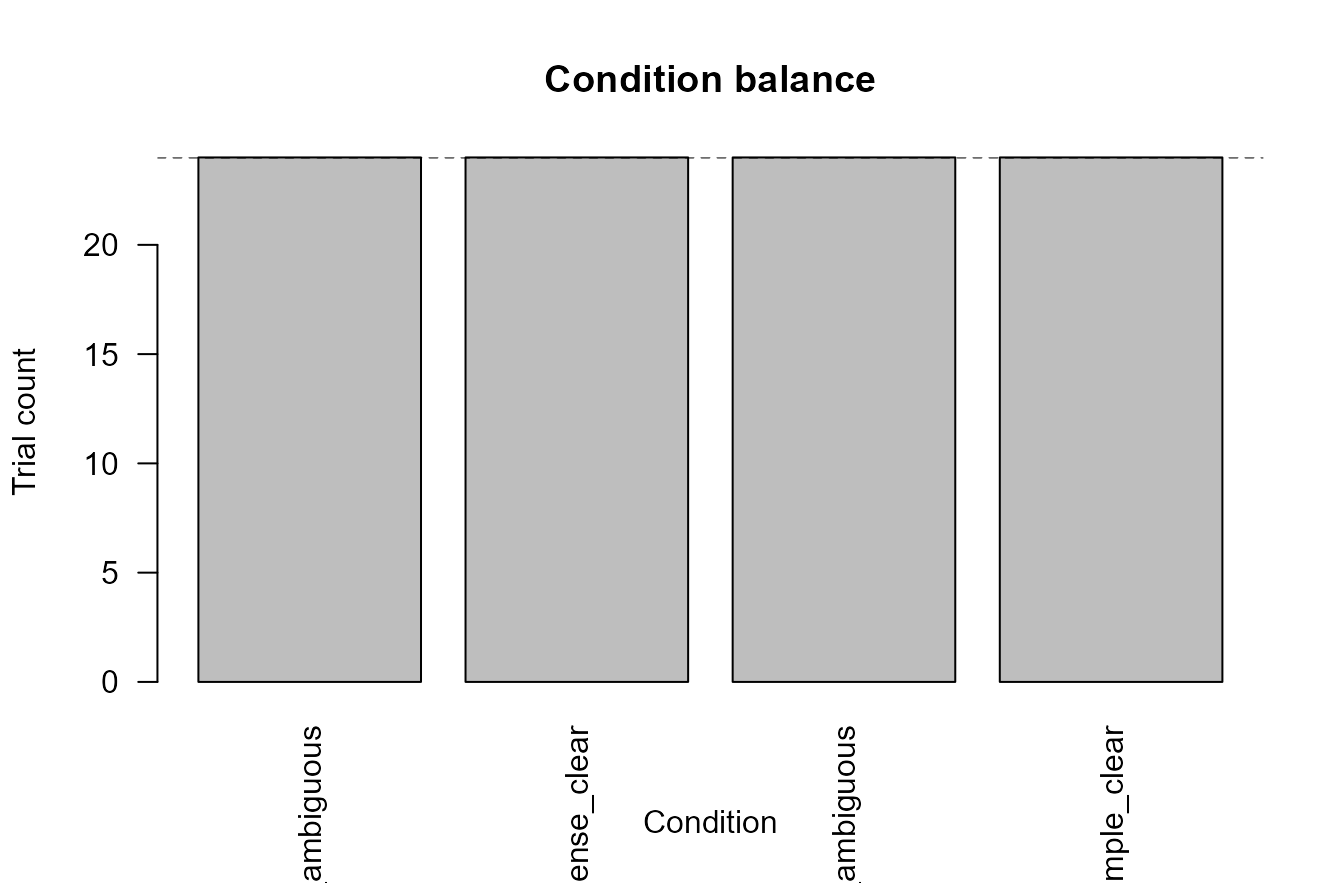
Synthetic condition-balance audit.
Participant and session coverage
Participant/session coverage shows whether missingness is concentrated in a session block or subgroup of recordings.
coverage <- aggregate(
  cbind(
    sample_coverage = design$samples_observed / design$samples_expected,
    event_coverage = design$observed_events / design$expected_events,
    metadata_complete = design$metadata_complete
  ),
  by = list(participant_id = design$participant_id, session = design$session),
  FUN = mean
)

coverage$overall_coverage <- rowMeans(coverage[, c("sample_coverage", "event_coverage", "metadata_complete")])

coverage_matrix <- xtabs(overall_coverage * 100 ~ participant_id + session, coverage)

barplot(
  t(coverage_matrix),
  beside = TRUE,
  ylim = c(0, 105),
  ylab = "Coverage (%)",
  main = "Participant/session coverage",
  legend.text = TRUE,
  args.legend = list(x = "bottomright", bty = "n")
)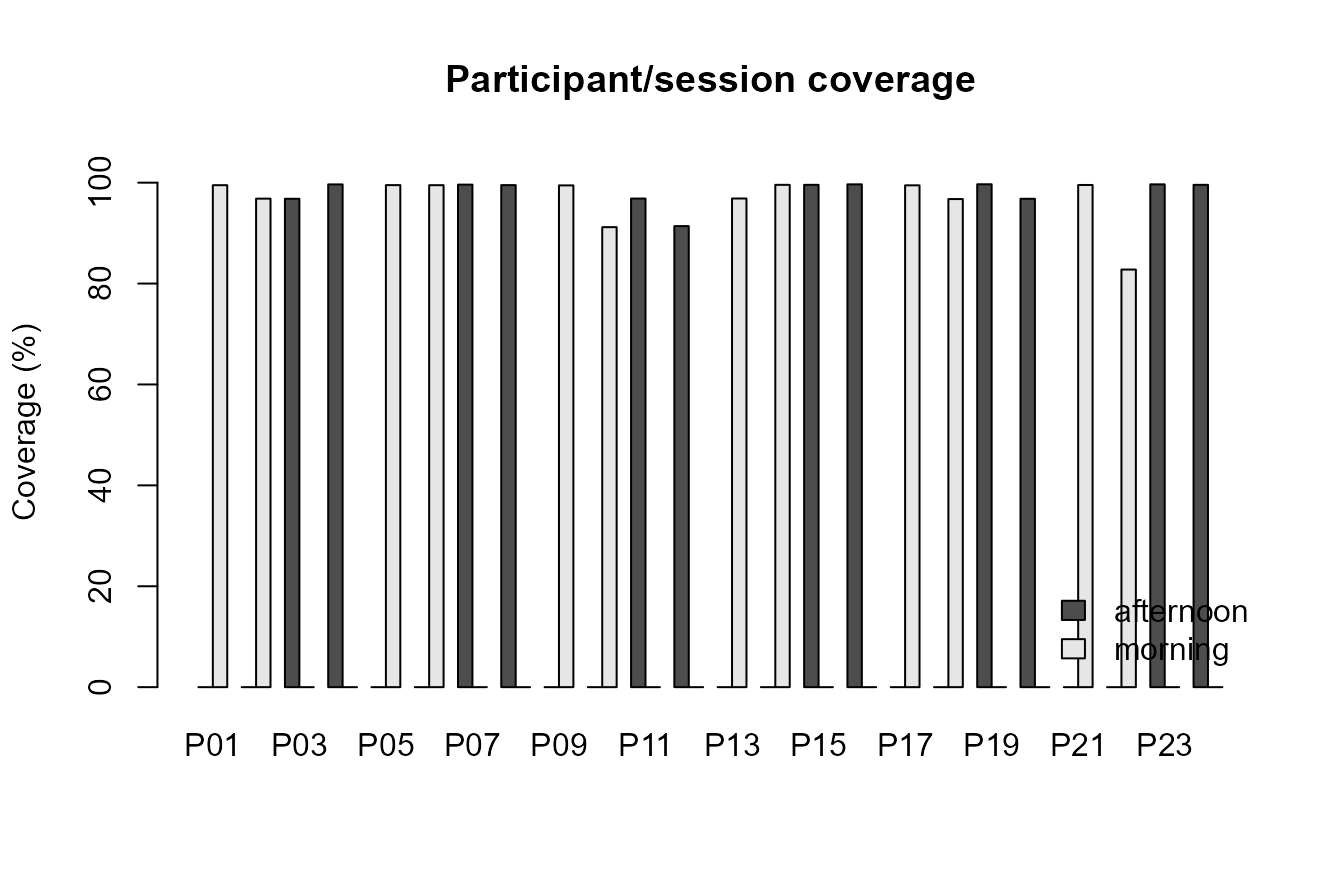
Synthetic participant/session coverage audit.
Event coverage
Event coverage checks whether expected markers are available before event-locked or multimodal-window analyses.
event_coverage <- aggregate(
  observed_events / expected_events ~ condition,
  data = design,
  FUN = mean
)
names(event_coverage)[2] <- "event_coverage"

barplot(
  event_coverage$event_coverage * 100,
  names.arg = event_coverage$condition,
  las = 2,
  ylim = c(0, 105),
  ylab = "Expected events observed (%)",
  main = "Event coverage"
)
abline(h = 95, lty = 2)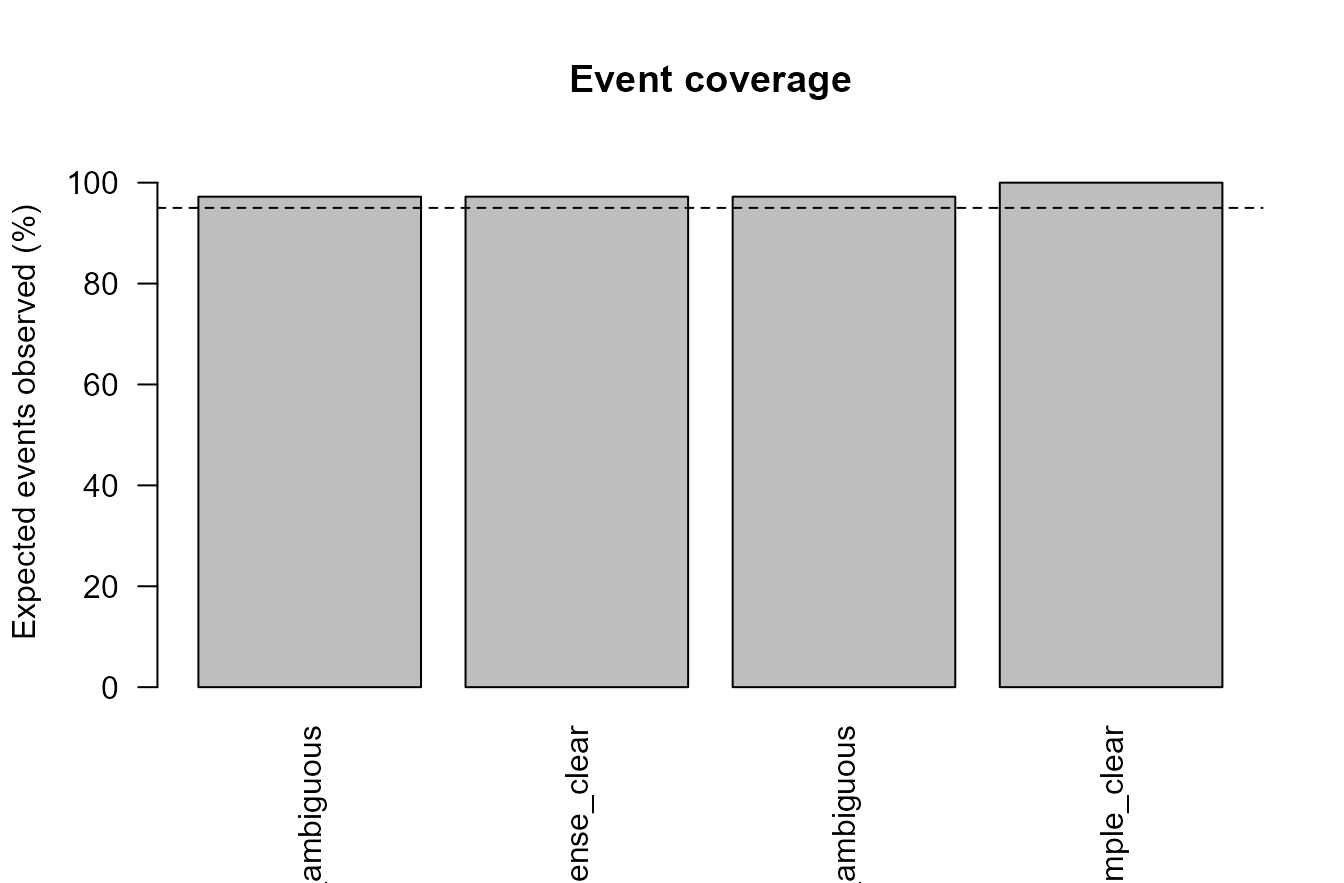
Synthetic event coverage by condition.
Export-schema coverage
Schema coverage shows whether expected file types are present and compatible with the current import contract.
schema_summary <- aggregate(
  cbind(file_present, schema_valid) ~ channel,
  data = exports,
  FUN = mean
)

schema_matrix <- rbind(
  file_present = schema_summary$file_present * 100,
  schema_valid = schema_summary$schema_valid * 100
)
colnames(schema_matrix) <- schema_summary$channel

barplot(
  schema_matrix,
  beside = TRUE,
  ylim = c(0, 105),
  ylab = "Participants covered (%)",
  main = "Export-schema coverage",
  legend.text = TRUE,
  args.legend = list(x = "bottomright", bty = "n")
)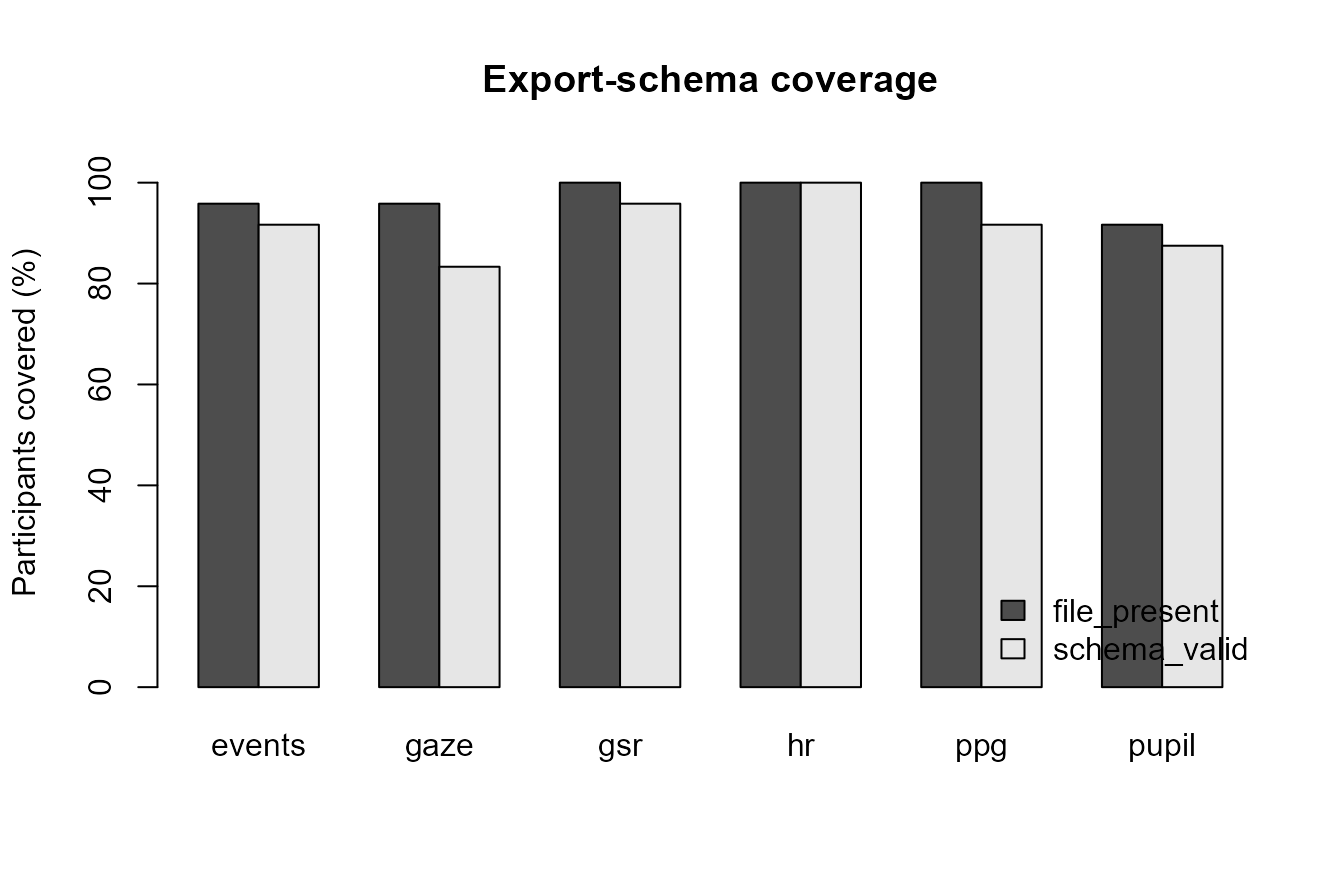
Synthetic export-schema coverage audit.
Channel availability
Channel-availability plots document which measurement streams are present and active before downstream preprocessing.
channel_summary <- aggregate(
  channel_active ~ channel,
  data = exports,
  FUN = mean
)

barplot(
  channel_summary$channel_active * 100,
  names.arg = channel_summary$channel,
  ylim = c(0, 105),
  ylab = "Active channel availability (%)",
  xlab = "Channel",
  main = "Channel availability"
)
abline(h = 90, lty = 2)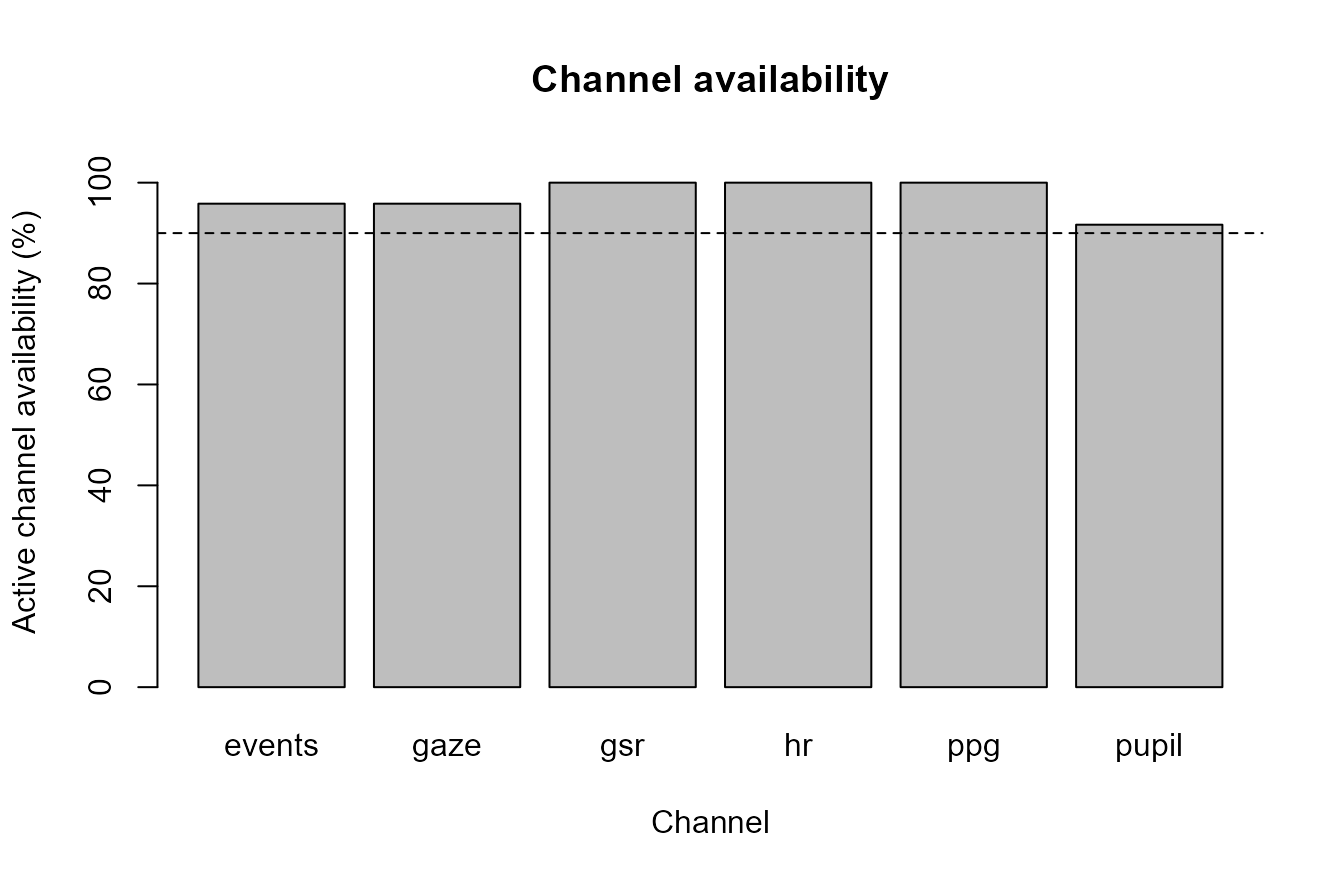
Synthetic active-channel availability audit.
Sampling-rate and timebase audit
Sampling and timebase displays help identify irregular recordings before interpolation, alignment, or event-window extraction.
op <- par(mfrow = c(1, 2), mar = c(4, 4, 3, 1))

hist(
  design$sampling_rate_hz,
  breaks = 16,
  xlab = "Estimated sampling rate (Hz)",
  main = "Sampling-rate audit"
)
abline(v = 60, lty = 2)

time_resets <- aggregate(time_reset_flag ~ condition, data = design, FUN = mean)
barplot(
  time_resets$time_reset_flag * 100,
  names.arg = time_resets$condition,
  las = 2,
  ylim = c(0, max(5, time_resets$time_reset_flag * 100) * 1.3),
  ylab = "Trials flagged (%)",
  main = "Timebase reset flags"
)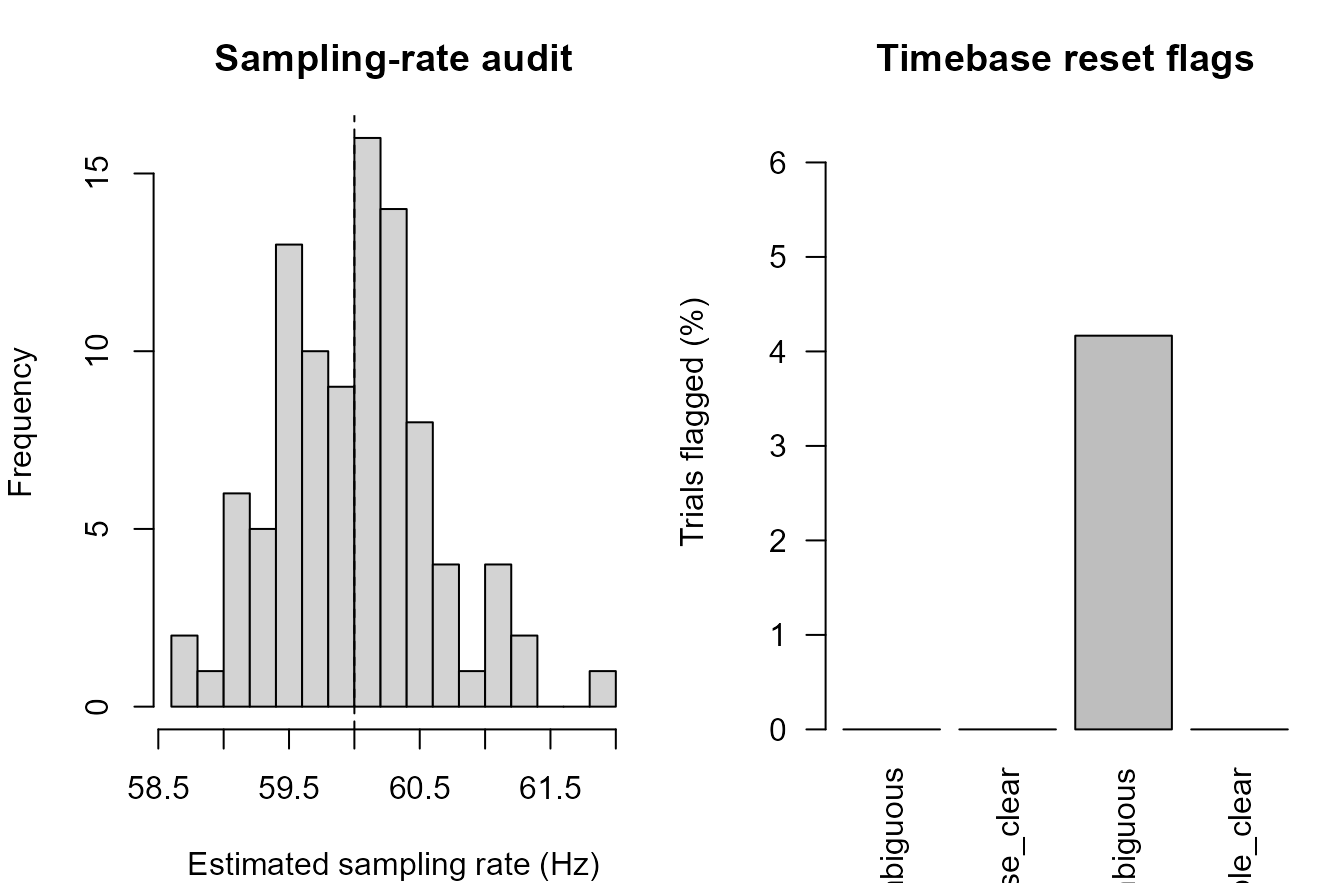
Synthetic sampling-rate and timebase audit.
par(op)Release-readiness score
A release-readiness score can summarize technical checks for review. It is a reporting aid, not a substitute for inspecting individual diagnostics.
participant_design <- aggregate(
  cbind(
    sample_coverage = design$samples_observed / design$samples_expected,
    event_coverage = design$observed_events / design$expected_events,
    metadata_complete = design$metadata_complete,
    no_time_reset = !design$time_reset_flag
  ),
  by = list(participant_id = design$participant_id),
  FUN = mean
)

participant_exports <- aggregate(
  cbind(file_present, schema_valid, channel_active) ~ participant_id,
  data = exports,
  FUN = mean
)

readiness <- merge(participant_design, participant_exports, by = "participant_id")
readiness$release_score <- 100 * rowMeans(readiness[, -1])
readiness <- readiness[order(readiness$release_score), ]

barplot(
  readiness$release_score,
  names.arg = readiness$participant_id,
  las = 2,
  ylim = c(0, 105),
  ylab = "Release-readiness score",
  main = "Participant-level release readiness"
)
abline(h = 90, lty = 2)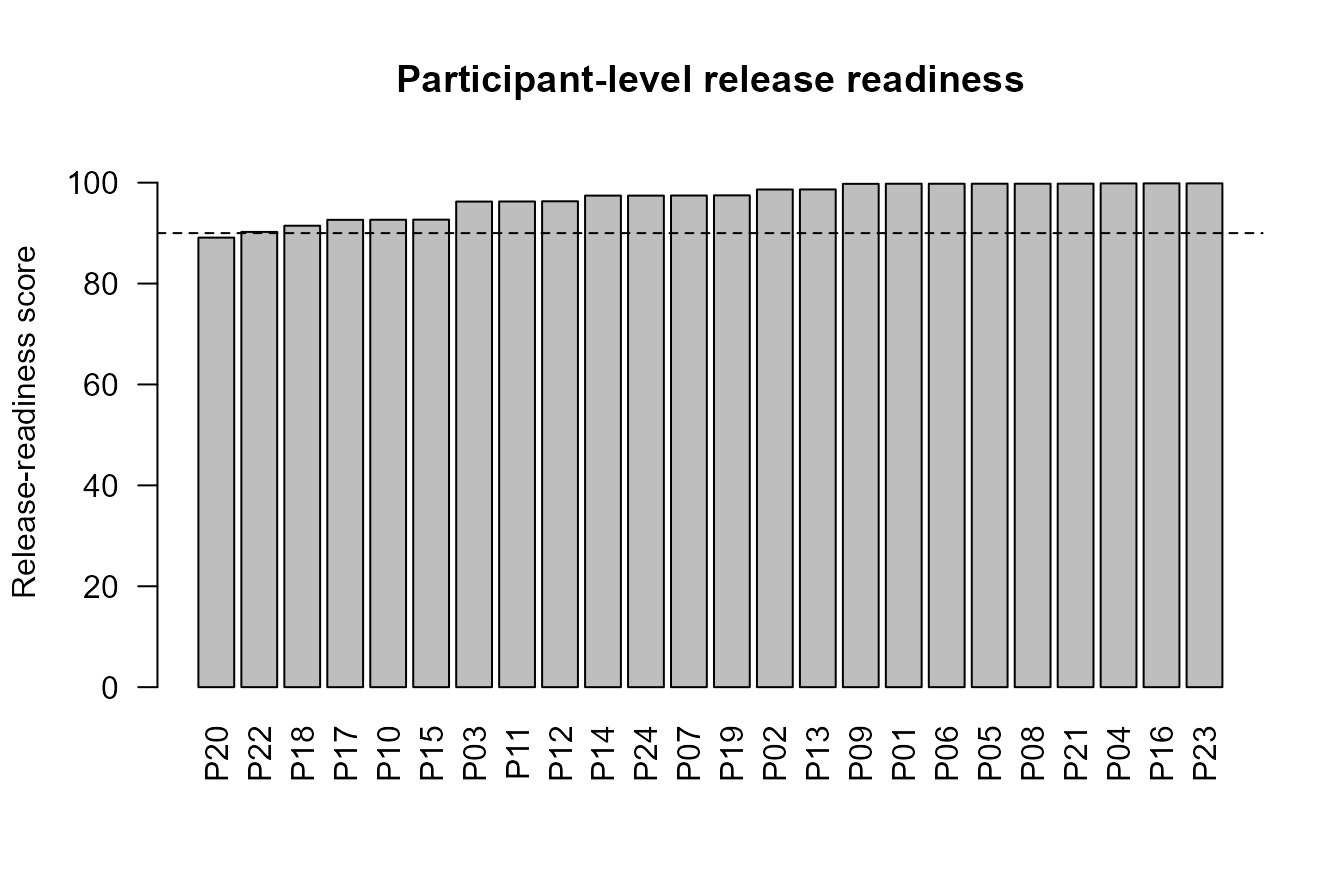
Synthetic release-readiness score by participant.
Compact design-release dashboard
A compact dashboard combines balance, coverage, schema, channel, sampling, and readiness checks into one review-oriented display.
op <- par(mfrow = c(2, 3), mar = c(4, 4, 3, 1))

barplot(condition_counts, las = 2, ylab = "Trials", main = "Balance")

barplot(event_coverage$event_coverage * 100, names.arg = event_coverage$condition, las = 2, ylim = c(0, 105), ylab = "Events (%)", main = "Events")

barplot(schema_summary$schema_valid * 100, names.arg = schema_summary$channel, ylim = c(0, 105), ylab = "Valid schema (%)", main = "Schema")

barplot(channel_summary$channel_active * 100, names.arg = channel_summary$channel, ylim = c(0, 105), ylab = "Active (%)", main = "Channels")

hist(design$sampling_rate_hz, breaks = 12, xlab = "Hz", main = "Sampling")
abline(v = 60, lty = 2)

barplot(readiness$release_score, names.arg = readiness$participant_id, las = 2, ylim = c(0, 105), ylab = "Score", main = "Readiness")
abline(h = 90, lty = 2)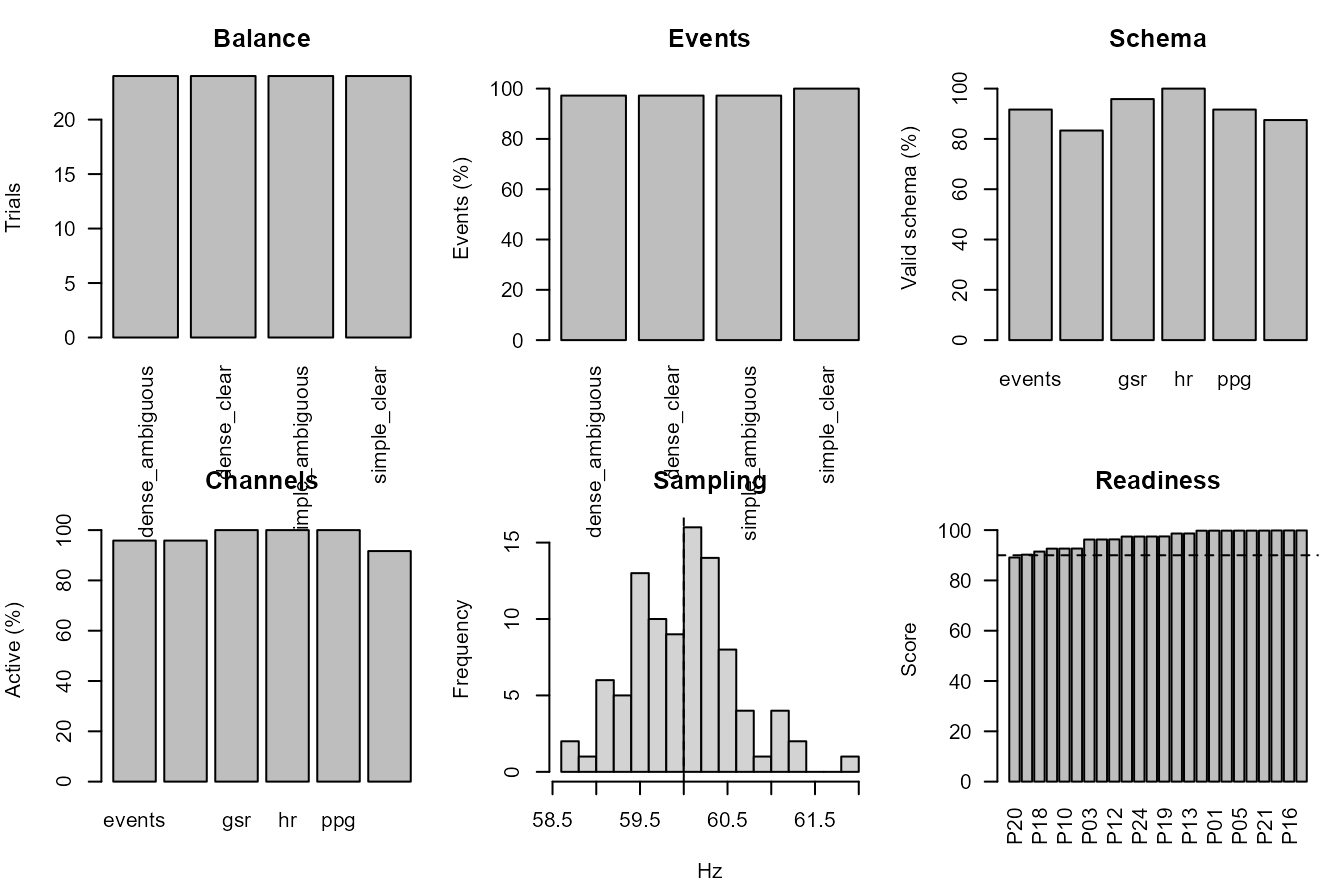
Compact synthetic design-release visual audit dashboard.
par(op)Relation to gpbiometrics helpers
The same reporting pattern can be paired with package-level helpers when project data use the expected column contracts.
| task | representative_helpers |
|---|---|
| Design and metadata validation | validate_gazepoint_metadata(); validate_gazepoint_biometrics() |
| Condition balance | audit_gazepoint_condition_balance(); plot_gazepoint_design_coverage() |
| Dataset-structure audit | audit_gazepoint_dataset_structure(); summarize_gazepoint_feature_coverage() |
| Event coverage | audit_gazepoint_event_coverage(); match_gazepoint_events_to_biometrics() |
| Export-schema coverage | audit_gazepoint_export_schema(); profile_gazepoint_export_folder() |
| Sampling and timebase checks | audit_gazepoint_biometric_sampling(); audit_gazepoint_time_resets() |
| Release readiness | audit_gazepoint_release_readiness(); create_gazepoint_release_checklist() |
| Report outputs | create_gazepoint_qc_supplement(); create_gazepoint_biometrics_report_tables() |
library(gpbiometrics)

metadata_check <- validate_gazepoint_metadata(
  metadata,
  required_cols = c("participant_id", "trial_id", "condition")
)

balance <- audit_gazepoint_condition_balance(
  metadata,
  condition_col = "condition",
  participant_col = "participant_id"
)

schema <- audit_gazepoint_export_schema(
  export_profile,
  required_channels = c("pupil", "gaze", "gsr", "ppg", "hr", "events")
)

sampling <- audit_gazepoint_biometric_sampling(
  biometric_data,
  time_col = "TIME_MS",
  participant_col = "participant_id",
  trial_col = "trial_id"
)

time_resets <- audit_gazepoint_time_resets(
  biometric_data,
  time_col = "TIME_MS",
  participant_col = "participant_id",
  trial_col = "trial_id"
)

release <- audit_gazepoint_release_readiness(
  metadata_check = metadata_check,
  balance_check = balance,
  schema_check = schema,
  sampling_check = sampling,
  timebase_check = time_resets
)

plot_gazepoint_design_coverage(balance)
create_gazepoint_release_checklist(release)
Reporting recommendation
For manuscripts, technical supplements, repositories, and reviewer-facing reports, describe these figures as design, metadata, export-schema, event-coverage, sampling, timebase, quality-control, and release-readiness diagnostics. Avoid stronger substantive interpretation unless supported by the study design, validation evidence, controls, and modelling results.