
Plot gallery
This article showcases all exported plot_* helpers in
gpbiometrics using synthetic Gazepoint-like data.
The example code is hidden so that the page functions as a compact visual gallery. Function names are shown above each rendered example.
The examples are for documentation and visual inspection only. The synthetic signals are not real physiology and should not be interpreted as emotion, stress, cognition, preference, health status, or diagnosis.






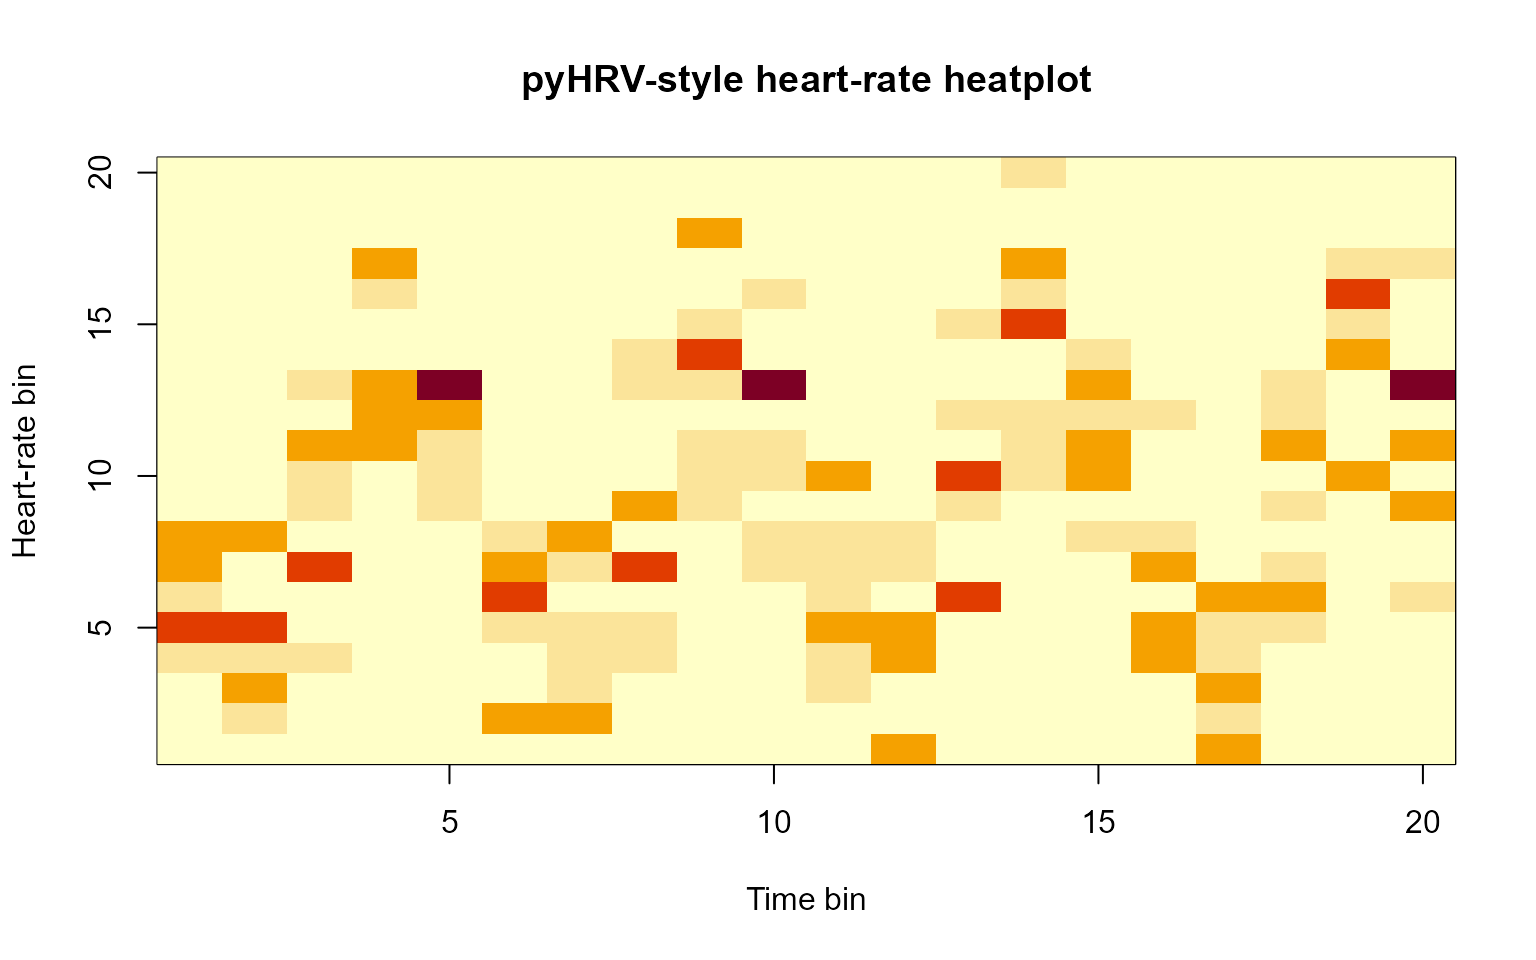



Extended QC and reporting plot examples
This section adds representative plot calls for common
gpbiometrics quality-control, signal-processing,
event-alignment, AOI, reporting, and toolbox-bridge workflows.
The examples are intended as plotting contracts and documentation patterns. They show how diagnostic and report-ready figures can be produced from synthetic or already processed data. They should not be interpreted as direct evidence of emotion, stress, attention, workload, clinical status, diagnosis, health condition, or psychological response.
Missingness and signal-quality plots
Missingness and signal-quality plots are useful for checking coverage and candidate data-quality issues before modelling.
Timing and activity plots
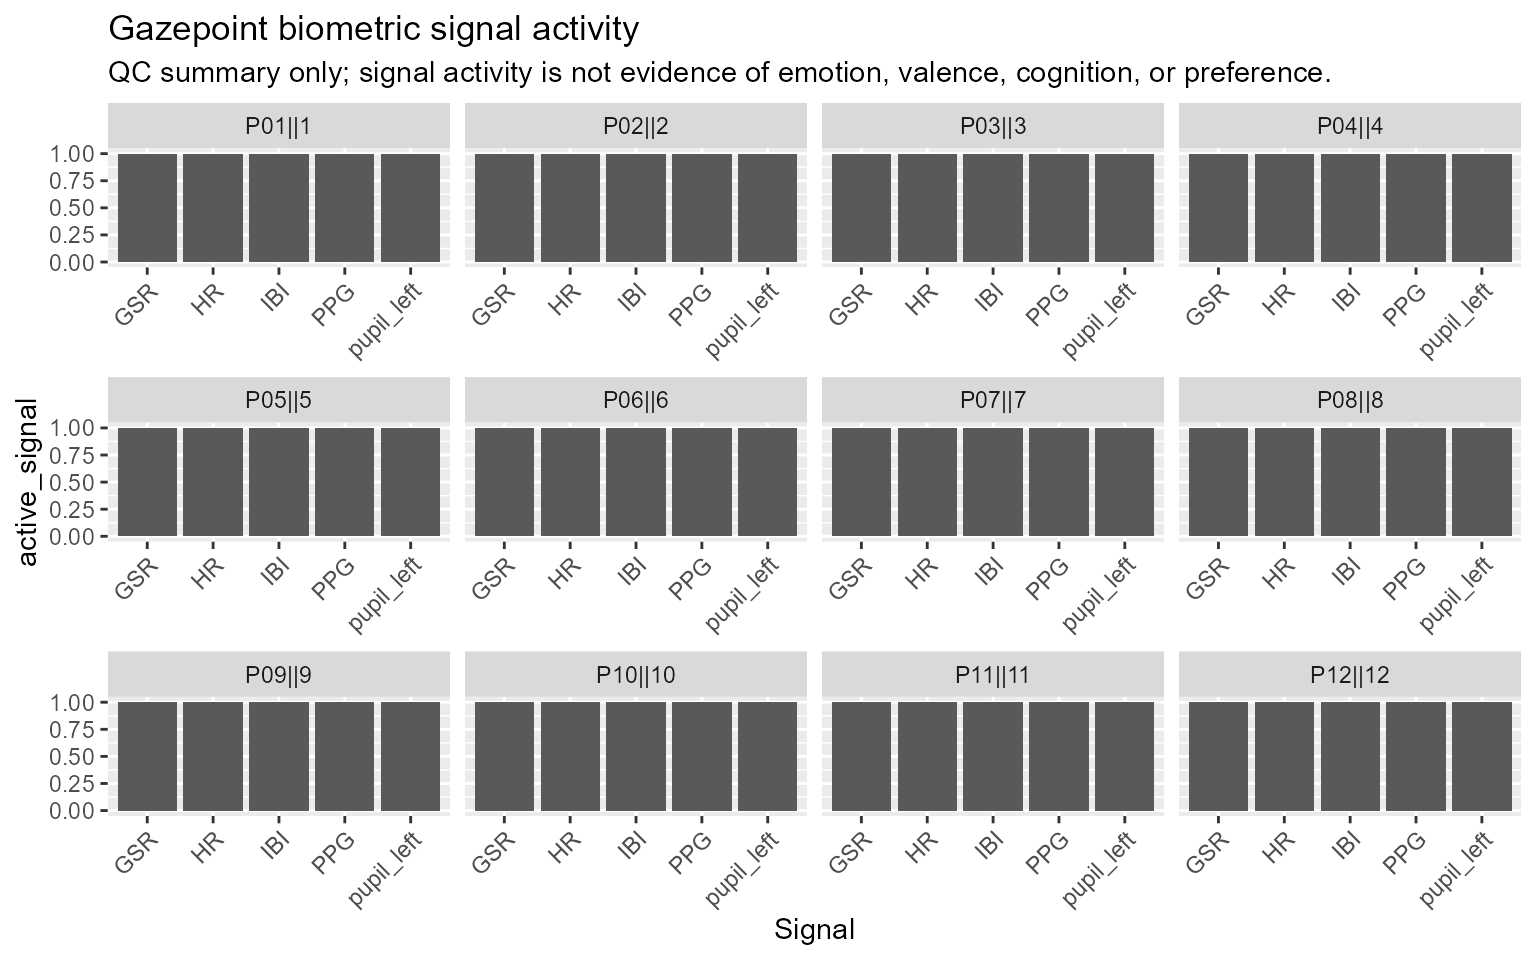
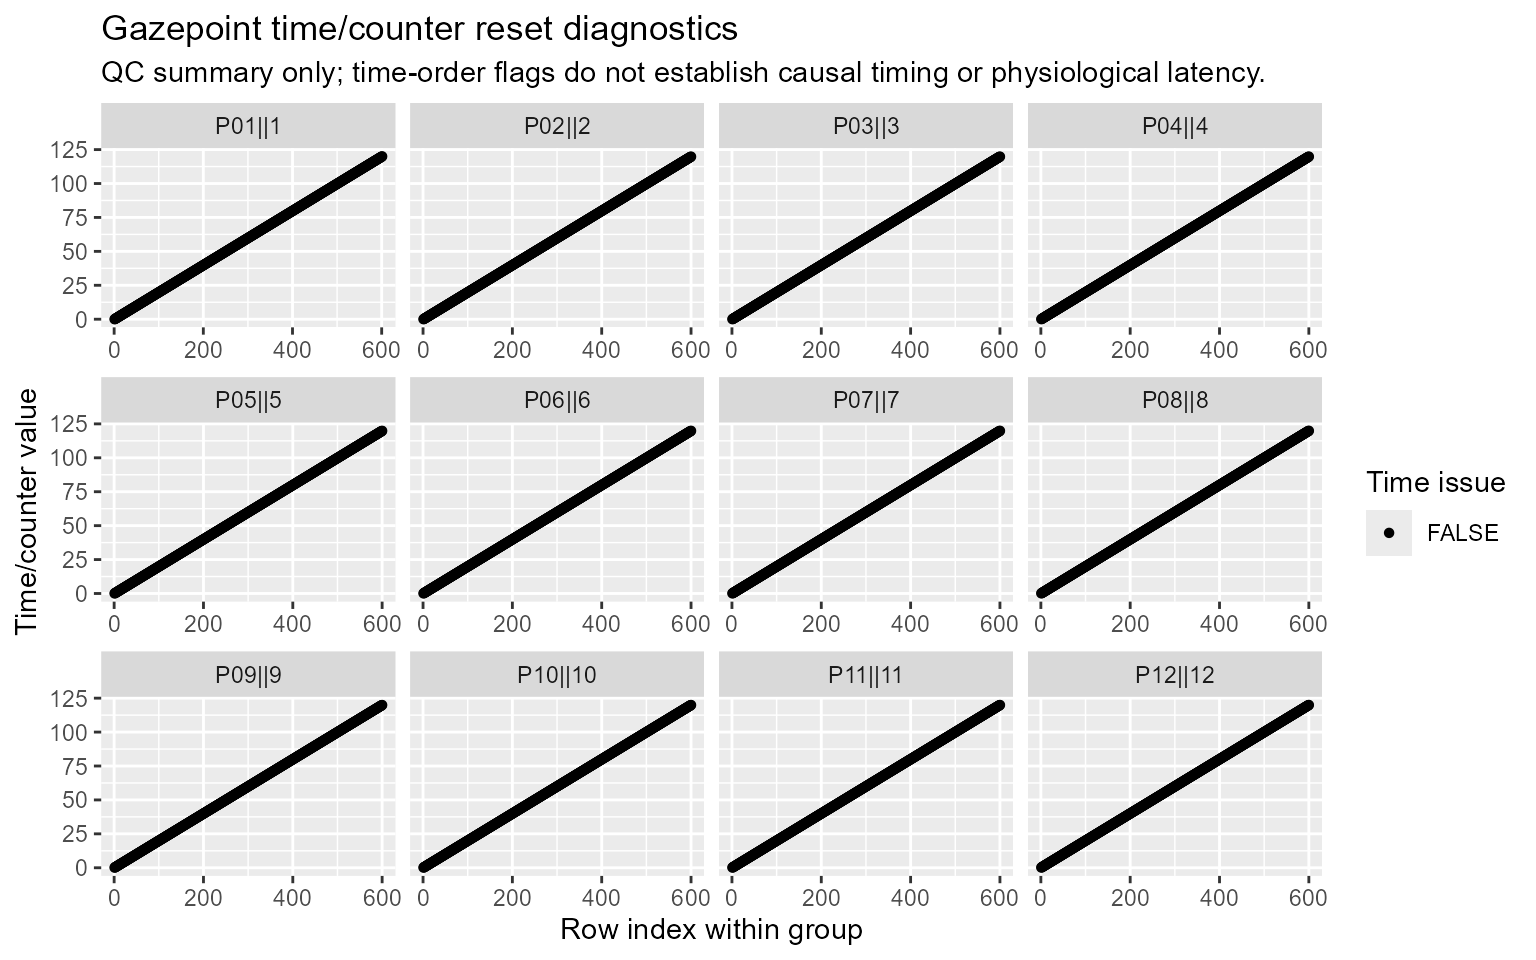
Timing and activity plots help document sample availability, active channels, and possible time-reset issues.
Raw and processed signal plots
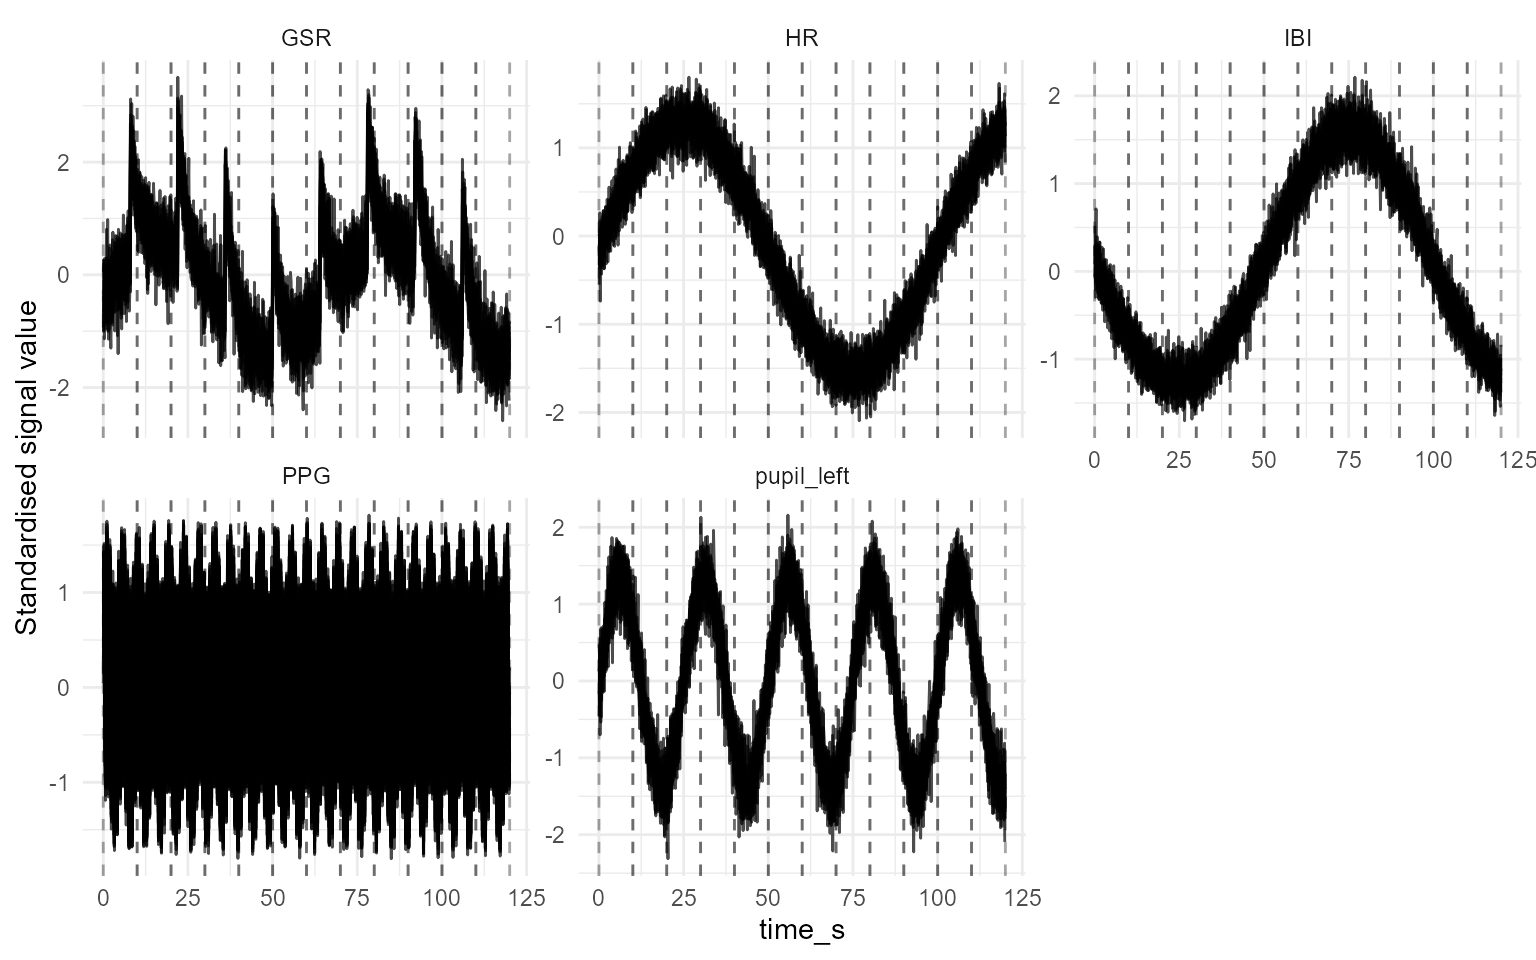
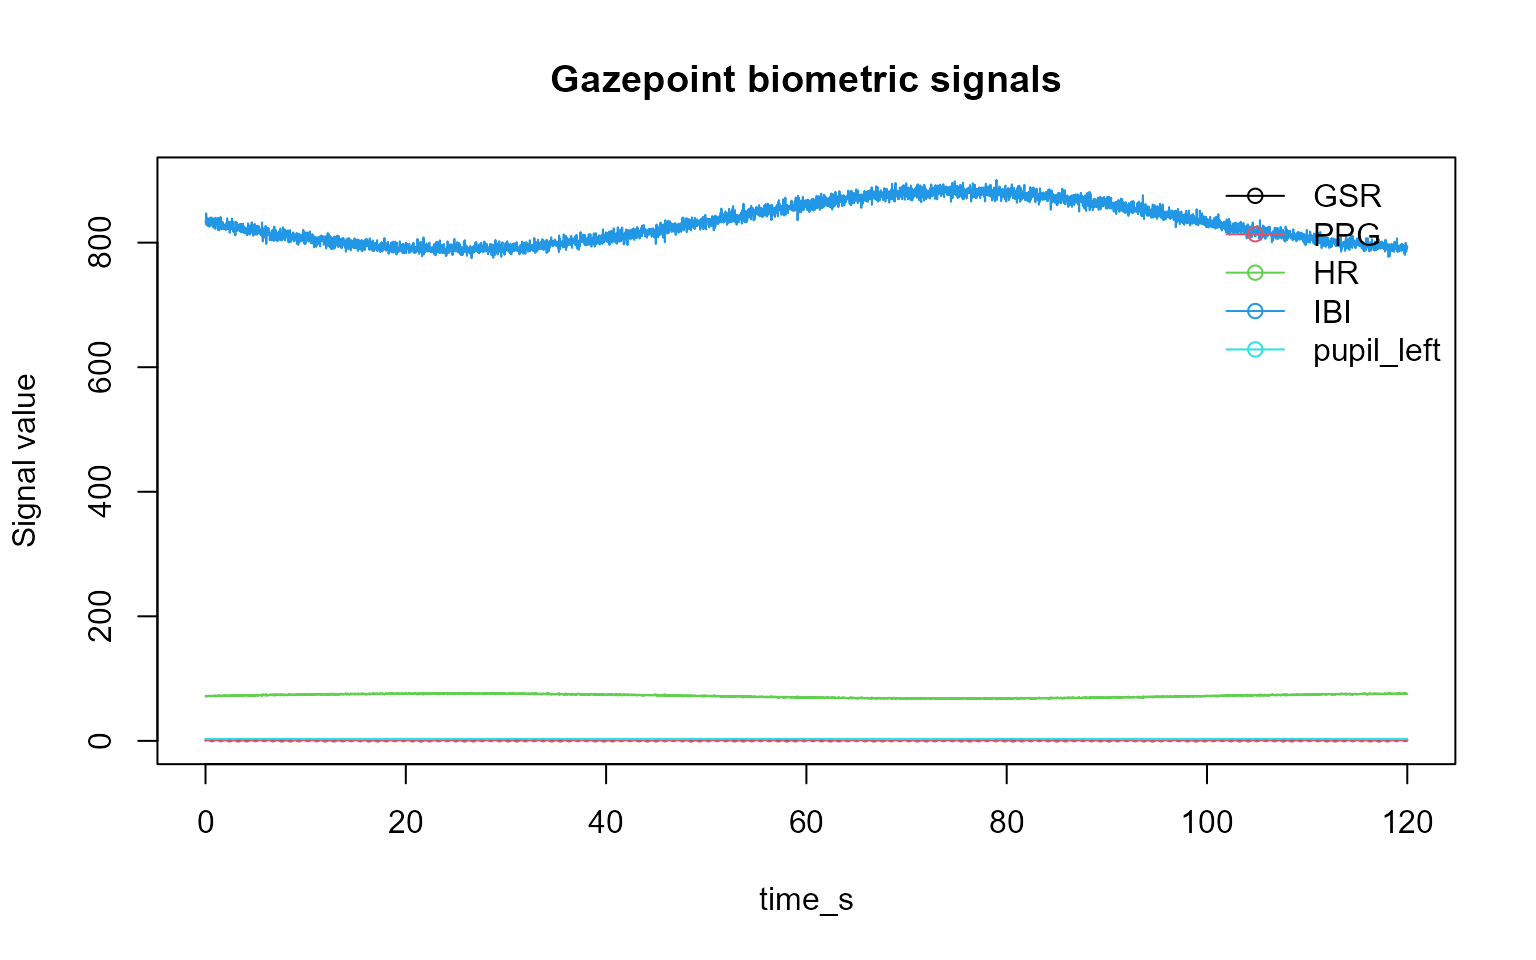
Signal plots should identify the plotted channel and preprocessing state.
EDA, GSR, and SCR plots
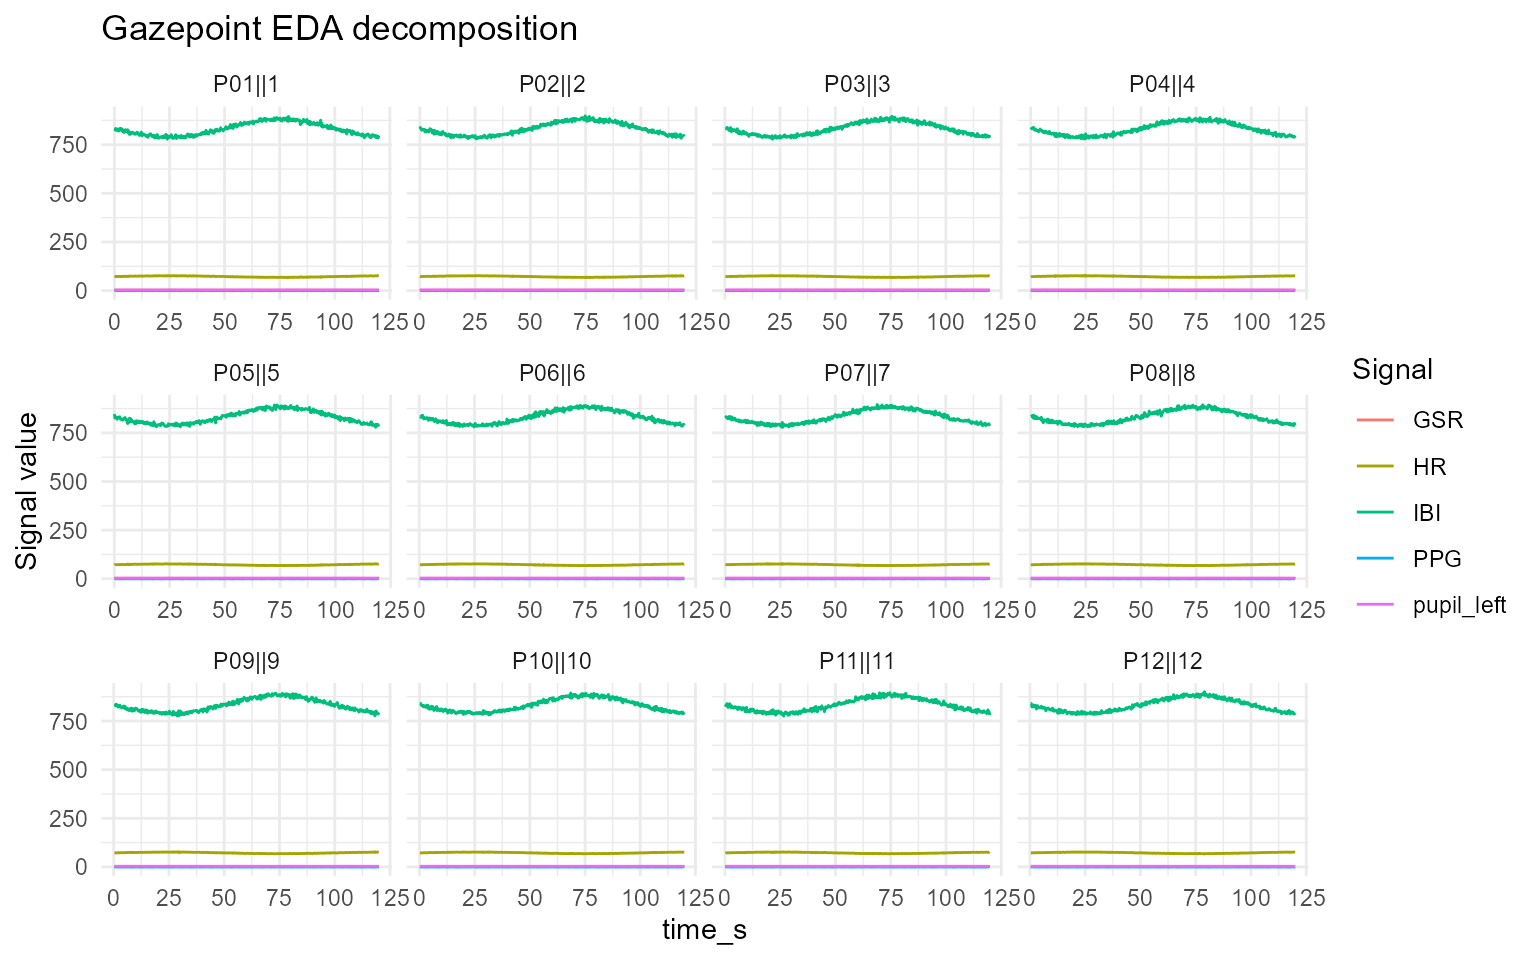
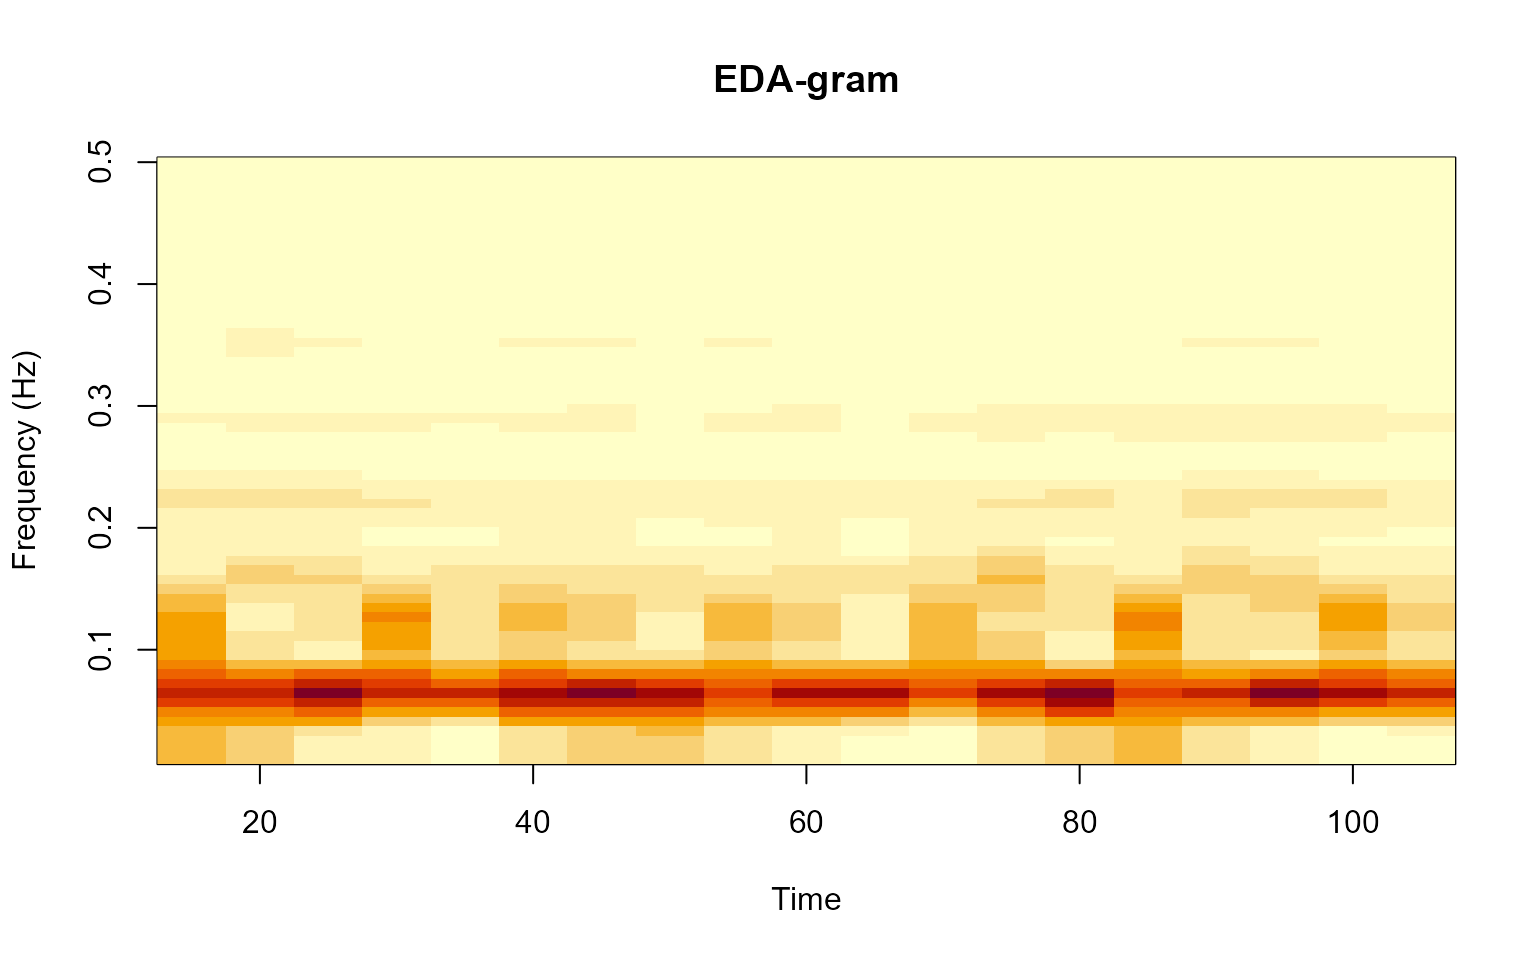
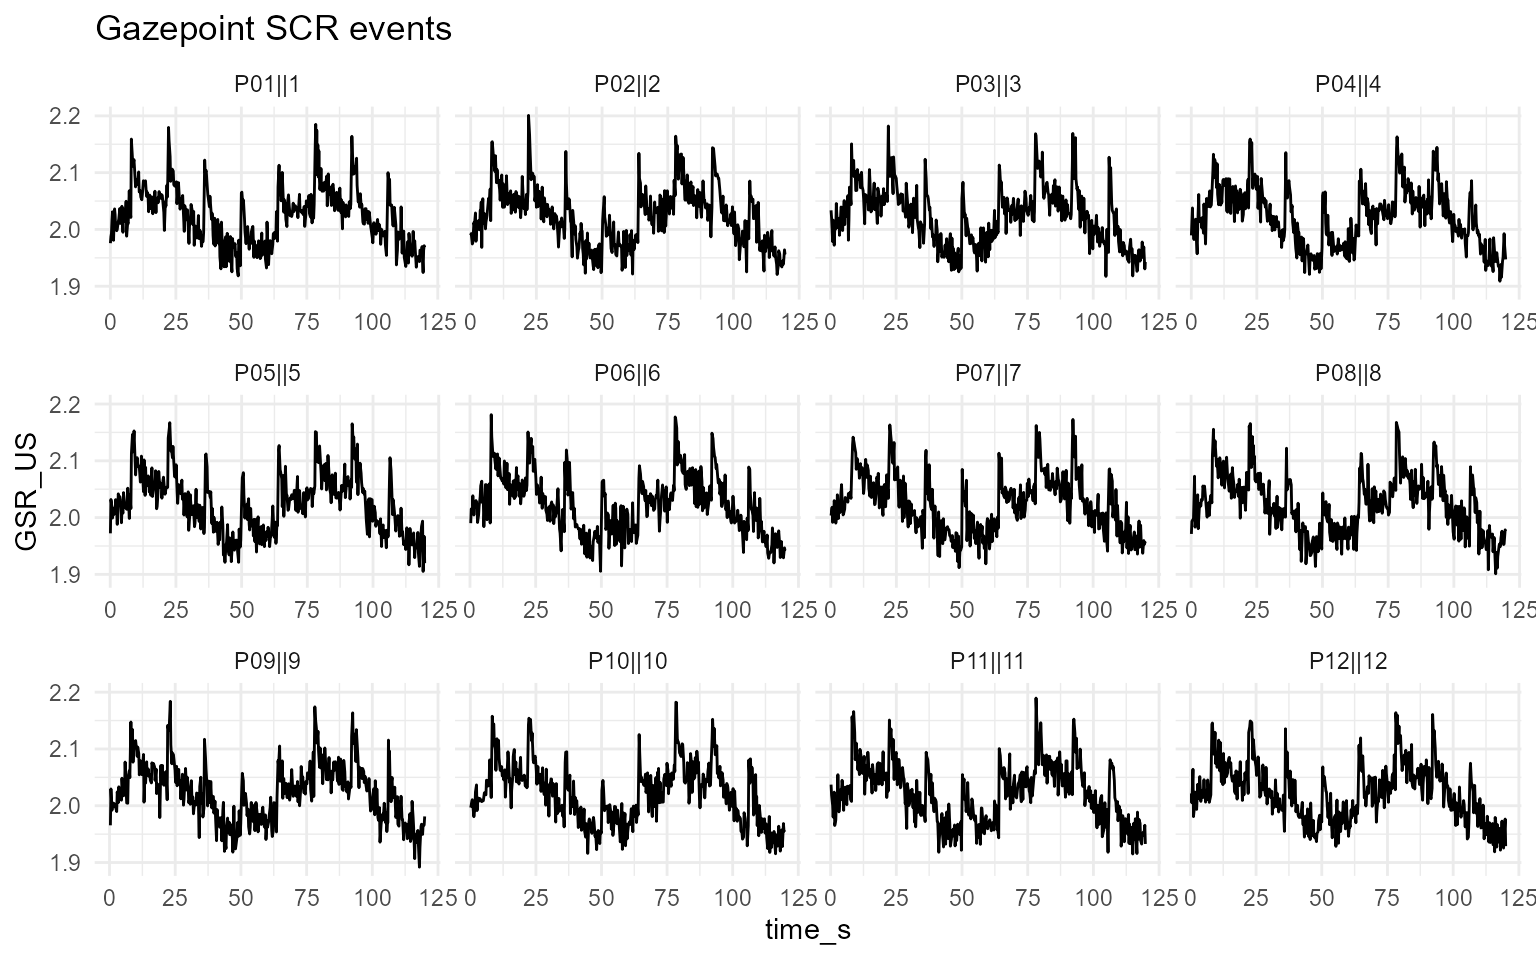
EDA/GSR/SCR plots document preprocessing, decomposition, and candidate event detection.
PPG, IBI, HRV, and respiration-proxy plots
PPG and interval plots document signal-processing and feature-extraction outputs.
Event-alignment, AOI, and multimodal plots
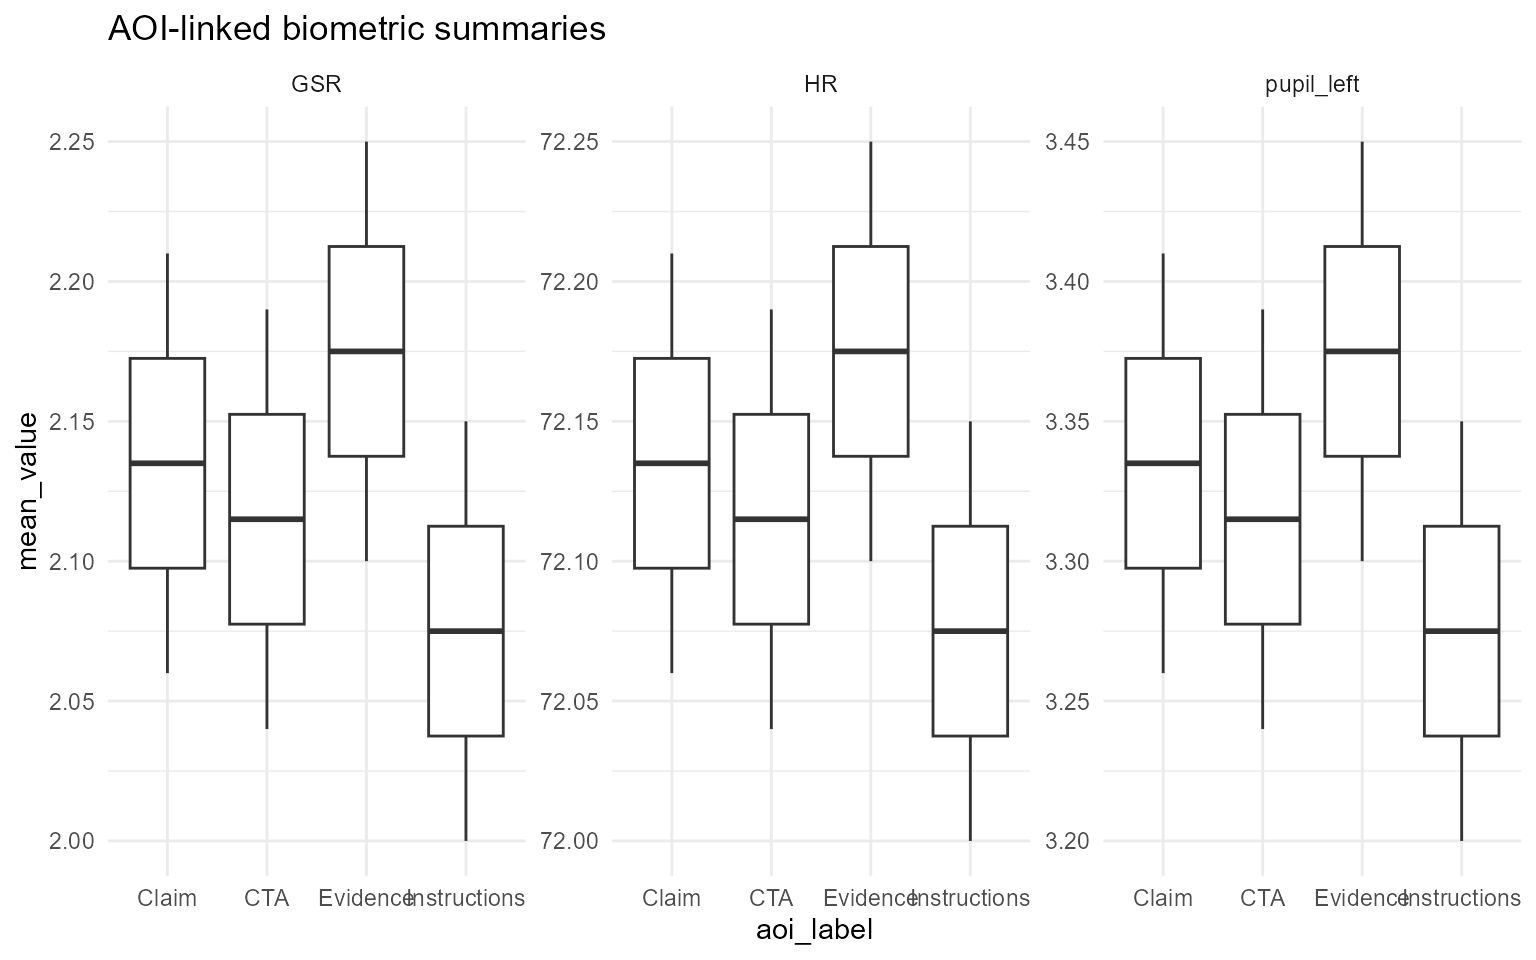
Event-alignment and AOI-linked plots show synchronized summaries and should be reported as feature-engineering outputs.