Plot a Gazepoint gaze or fixation heatmap
Source:R/heatmap_spatial_visualisation.R
plot_gazepoint_heatmap.Rdplot_gazepoint_heatmap() creates a binned spatial heatmap from gaze or
fixation coordinates. Points may optionally be weighted by duration.
Usage
plot_gazepoint_heatmap(
  data,
  x_col = NULL,
  y_col = NULL,
  weight_col = NULL,
  display_width = NULL,
  display_height = NULL,
  coordinate_space = c("auto", "normalized", "pixel"),
  bins = 60,
  alpha = 0.85,
  normalize = TRUE,
  show_points = FALSE,
  show_legend = TRUE
)
Arguments
- data
A data frame or an object returned by
prepare_gazepoint_heatmap_data().- x_col, y_col
Character strings giving x and y coordinate columns. These may be omitted when
datais already prepared byprepare_gazepoint_heatmap_data().- weight_col
Optional non-negative weight column, such as fixation duration.
- display_width, display_height
Display width and height in pixels.
- coordinate_space
One of
"auto","normalized", or"pixel".- bins
Number of bins. Either one integer or two integers for x and y.
- alpha
Heatmap layer transparency.
- normalize
Logical. If
TRUE, bin intensities are scaled to the range 0–1.- show_points
Logical. If
TRUE, raw points are added over the heatmap.- show_legend
Logical. If
TRUE, the fill legend is shown.
Examples
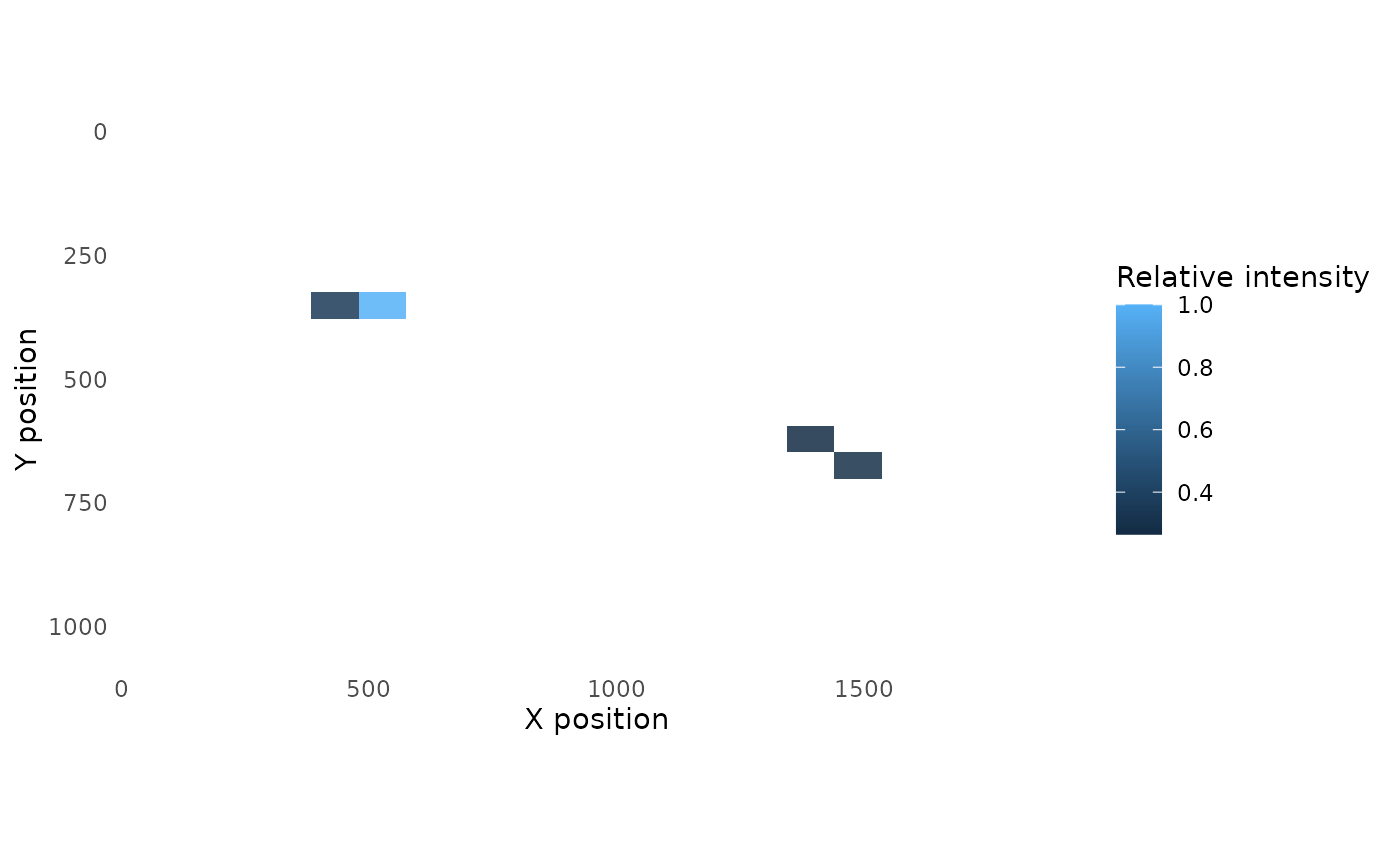
gaze <- data.frame(
  x = c(0.20, 0.25, 0.27, 0.70, 0.75),
  y = c(0.30, 0.32, 0.34, 0.55, 0.60),
  duration = c(120, 180, 160, 90, 100)
)

plot_gazepoint_heatmap(
  gaze,
  x_col = "x",
  y_col = "y",
  weight_col = "duration",
  display_width = 1920,
  display_height = 1080,
  bins = 20
)