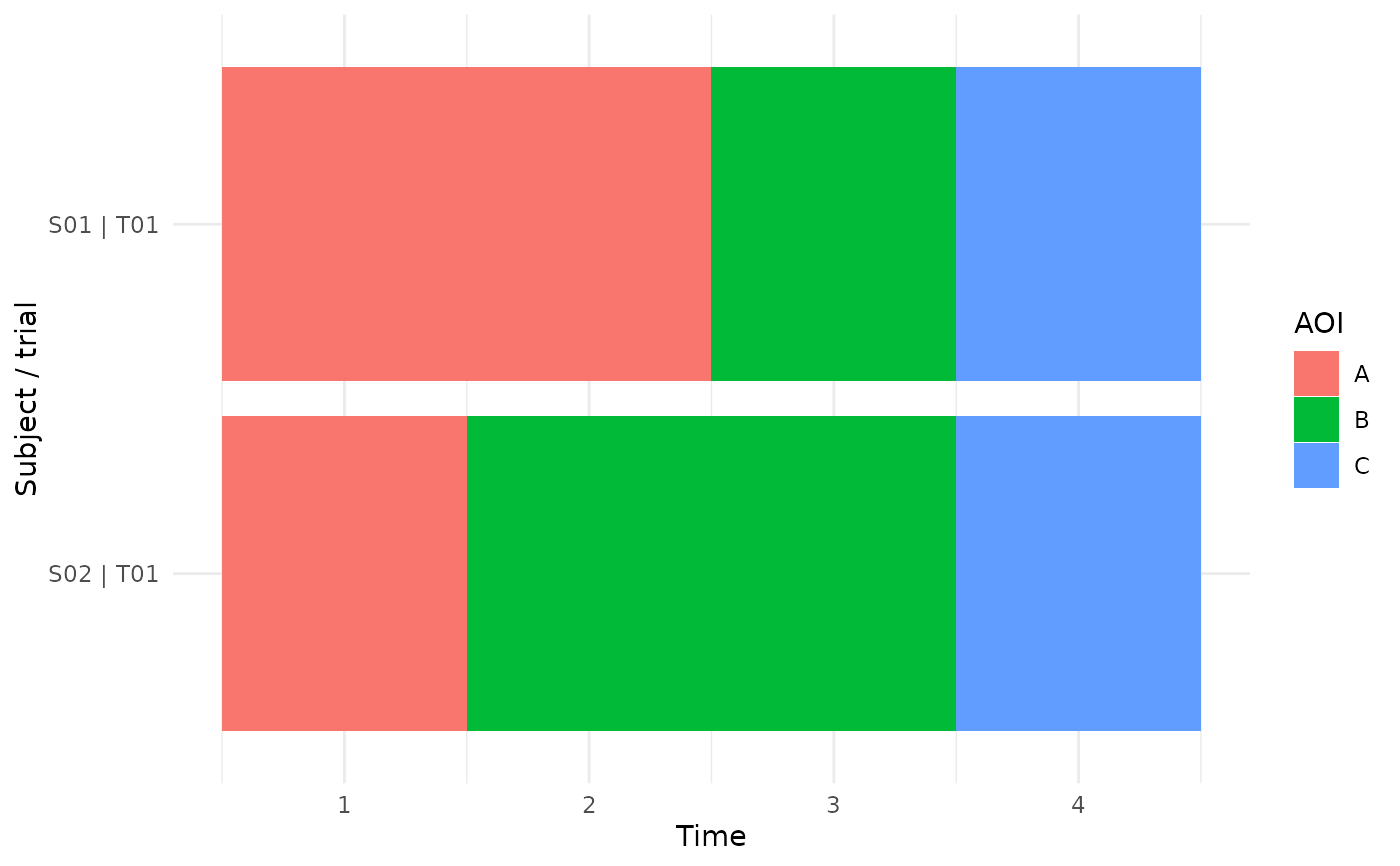
Creates a scarf-style timeline plot showing the current AOI over time for each subject, trial, or user-defined row grouping.
Usage
plot_gazepoint_aoi_timeline(
  data,
  aoi_col,
  time_col,
  y_col = NULL,
  subject_col = NULL,
  trial_col = NULL,
  group_cols = NULL,
  include_missing = FALSE,
  missing_label = "missing",
  sample_width = NULL,
  title = NULL,
  x_label = "Time",
  y_label = NULL,
  aoi_label = "AOI"
)
Arguments
- data
A data frame containing AOI observations.
- aoi_col
Character scalar. Column containing AOI labels.
- time_col
Character scalar. Column containing time values.
- y_col
Optional character scalar used directly as the y-axis row.
- subject_col
Optional subject column used to construct the y-axis row.
- trial_col
Optional trial column used to construct the y-axis row.
- group_cols
Optional character vector used to construct the y-axis row when
y_colis not supplied.- include_missing
Logical. If
TRUE, missing or empty AOI labels are retained asmissing_label; otherwise they are removed.- missing_label
Character scalar used when
include_missing = TRUE.- sample_width
Optional numeric tile width. If omitted, a median time difference is estimated.
- title
Optional plot title.
- x_label
X-axis label.
- y_label
Optional y-axis label.
- aoi_label
Fill legend label.
Examples
dat <- data.frame(
  subject = rep(c("S01", "S02"), each = 4),
  trial = "T01",
  time = rep(1:4, 2),
  AOI = c("A", "A", "B", "C", "A", "B", "B", "C")
)

plot_gazepoint_aoi_timeline(
  dat,
  aoi_col = "AOI",
  time_col = "time",
  subject_col = "subject",
  trial_col = "trial"
)