Publication Registries and Diagnostic Dashboards
Python-facing port of
publication-registries-and-dashboards.Rmdfrom the frozen R gp3bayes 0.5.0 reference. The statistical and governance framing below follows the canonical vignette; executable Python workflows use the mapped APIs listed later.
Registries bind named tables and figures to captions and provenance labels. They write nothing unless an explicit output path is supplied.
Dashboards are non-interactive evidence indices and do not launch expensive analyses implicitly.
Python API mapping
gp3bayespy.create_diagnostic_dashboardgp3bayespy.create_diagnostic_dashboard_figuresgp3bayespy.create_publication_registrygp3bayespy.diagnostic_dashboard_tablegp3bayespy.plot_diagnostic_dashboardgp3bayespy.plot_posterior_intervalsgp3bayespy.posterior_interval_tablegp3bayespy.publication_registry_tablegp3bayespy.register_publication_figuregp3bayespy.register_publication_tablegp3bayespy.validate_publication_registry
Python usage
import gp3bayespy as gp

# All functions listed above are available from the package root.
# Use help(gp.<function>) or the API reference for the exact Python signature.
Visual companion
These figures complement the canonical ported narrative and are generated from package functions.
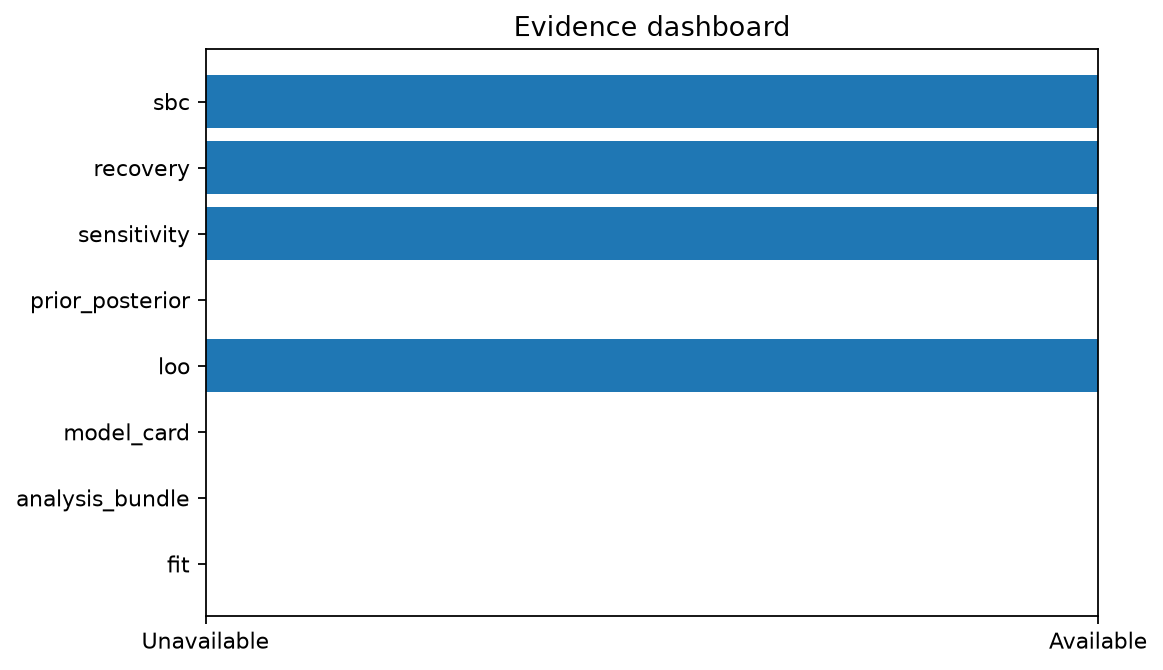
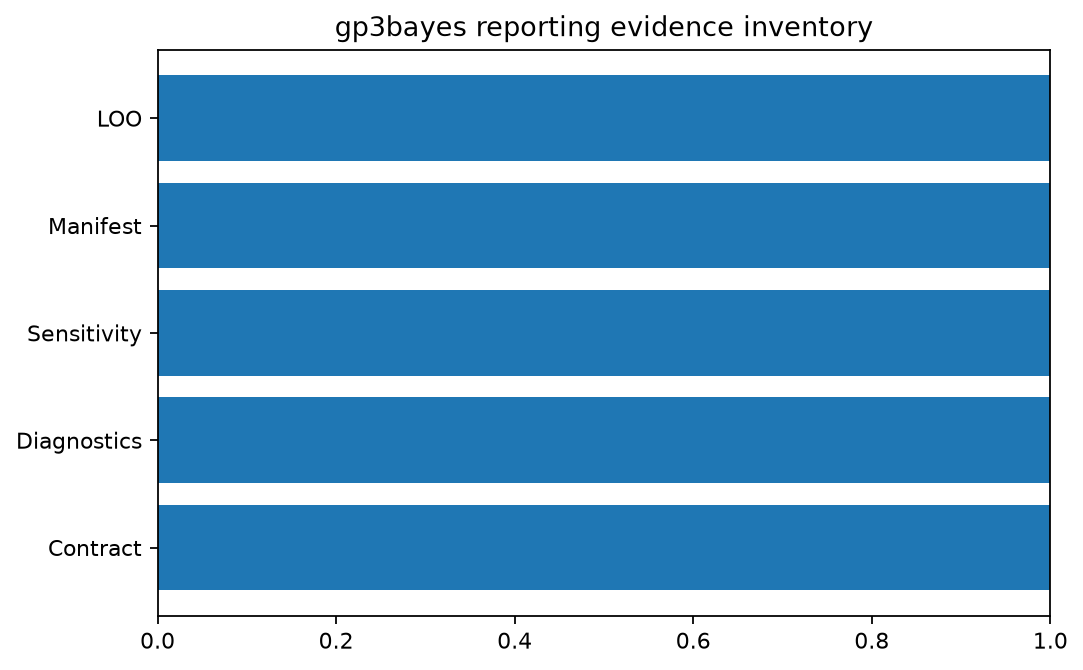
The figures remain descriptive evidence and do not create automatic inferential decisions.