Publication graphics gallery
This is a supplementary Python visual guide. It does not change the frozen 59/59 canonical article parity. Every image is generated deterministically from package functions.
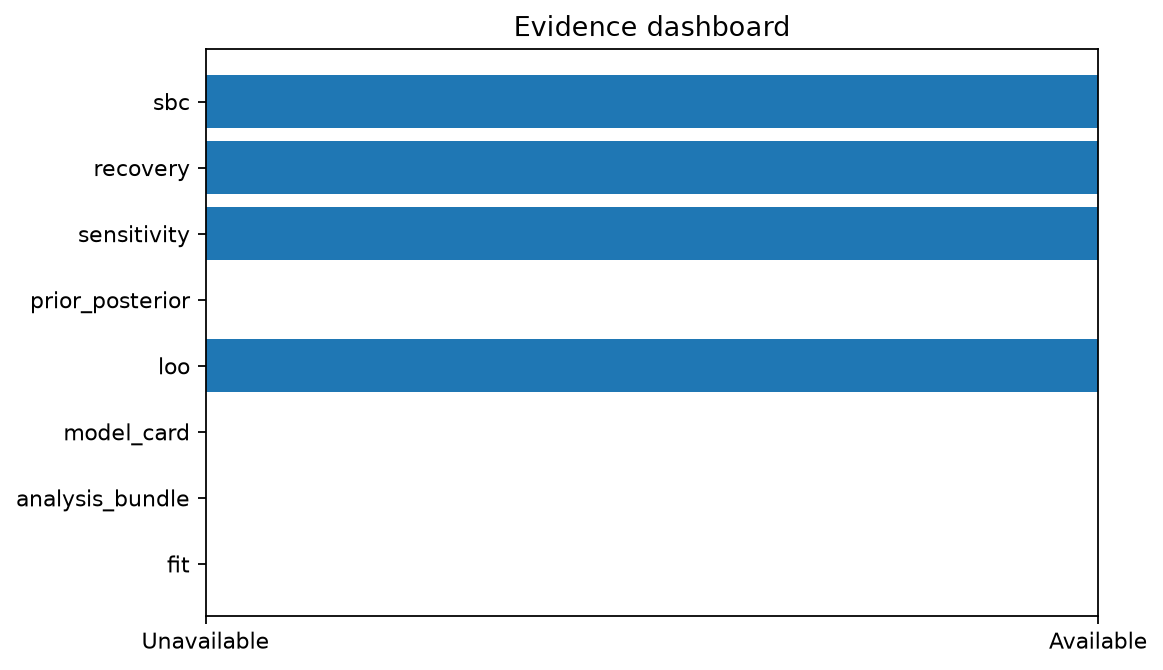
plot_diagnostic_dashboard()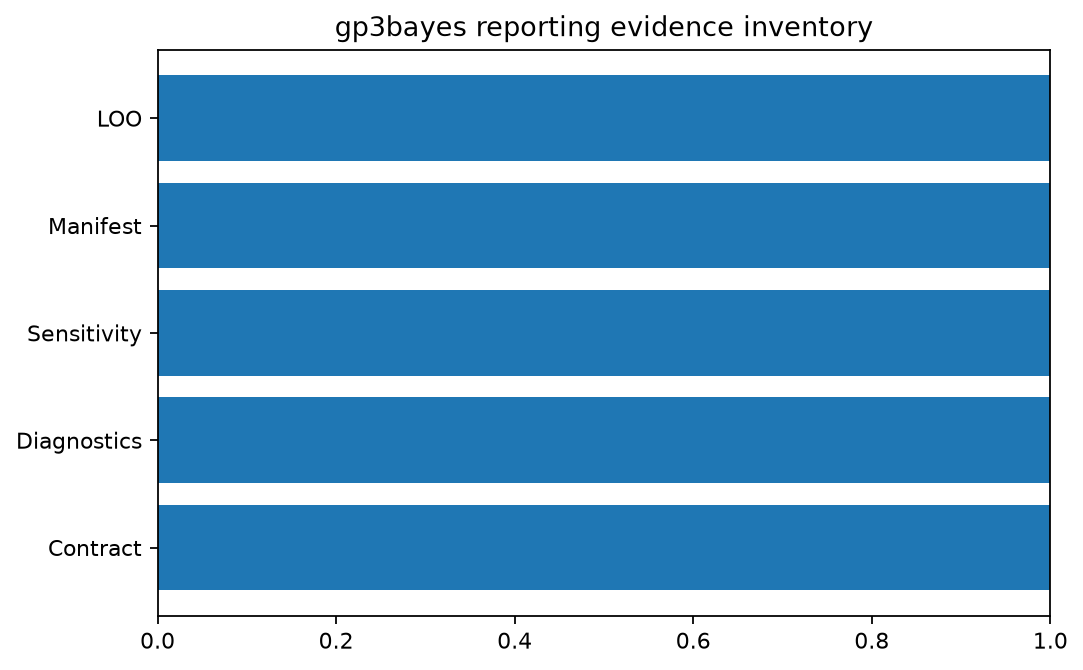
plot_reporting_checklist()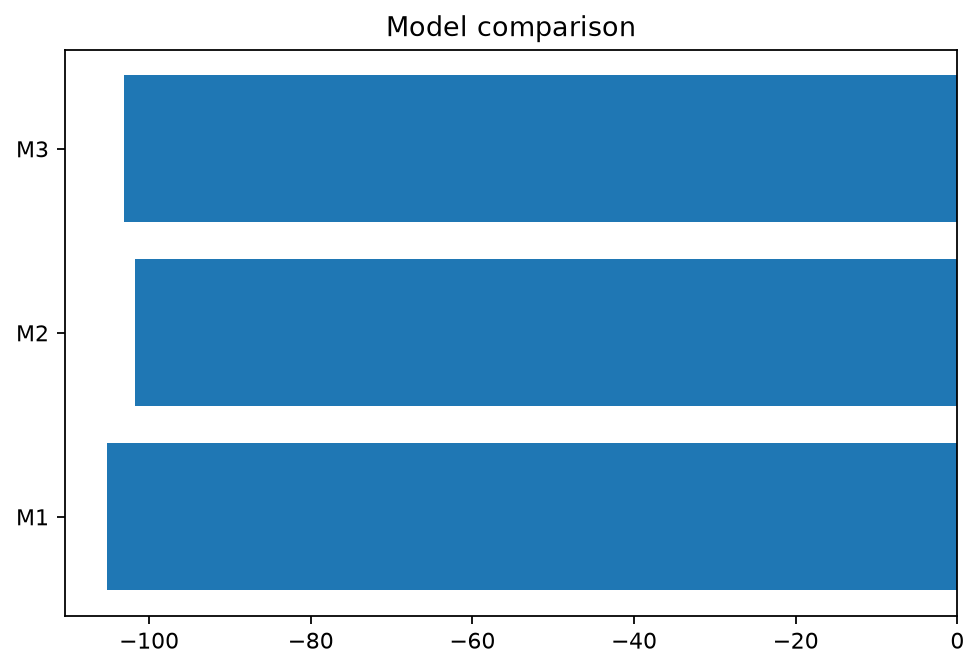
plot_model_comparison()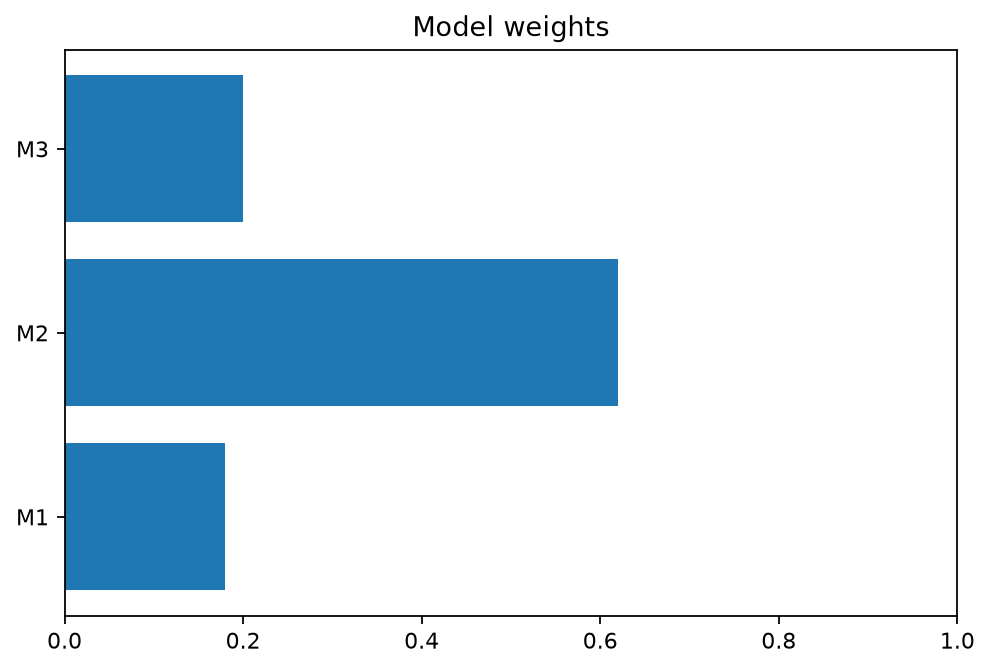
plot_model_weights()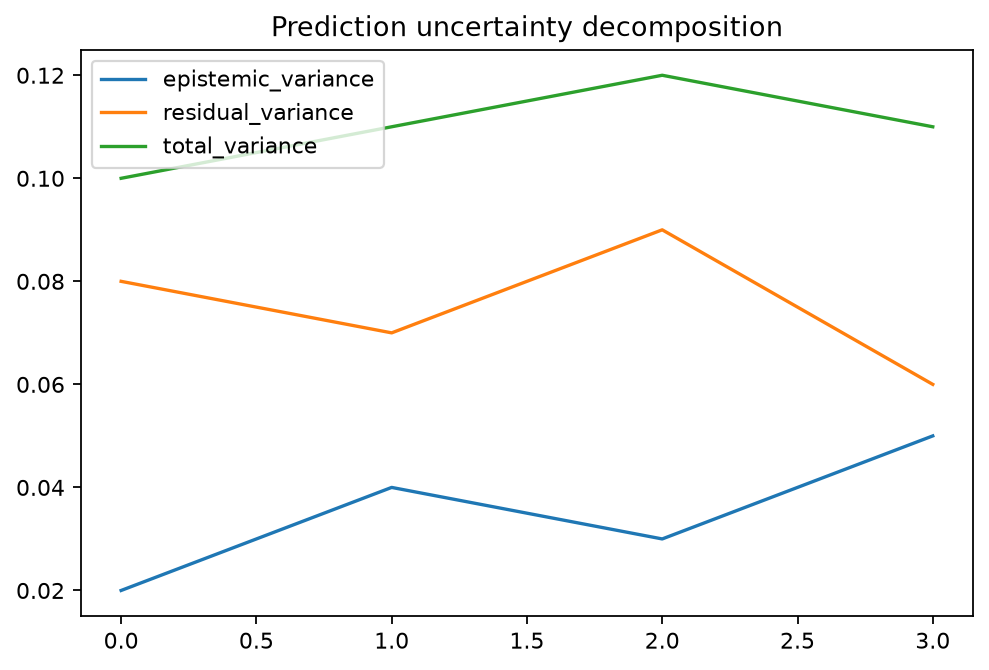
plot_uncertainty_decomposition()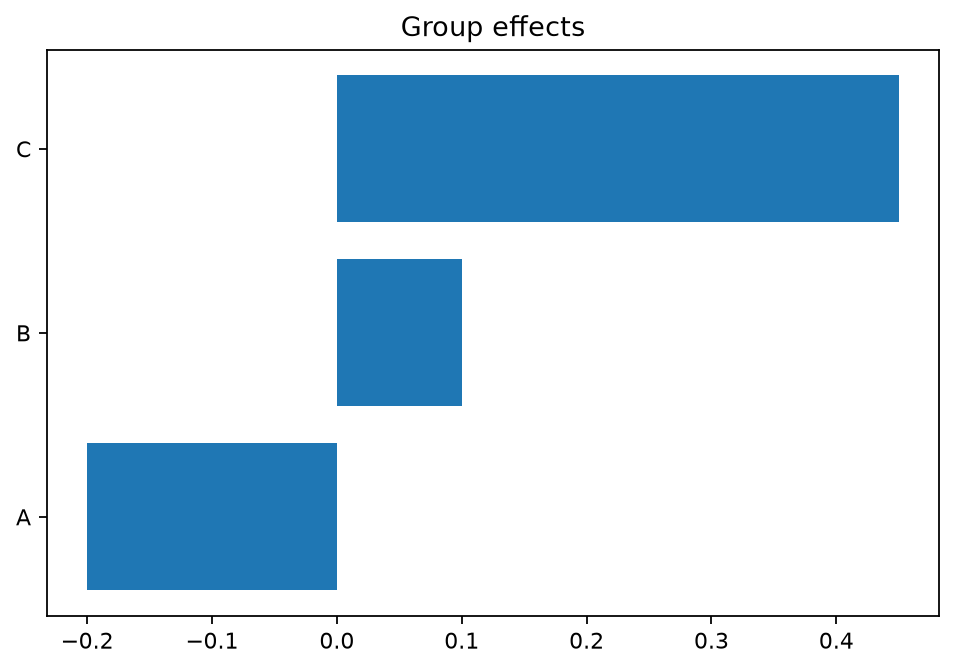
plot_group_effects()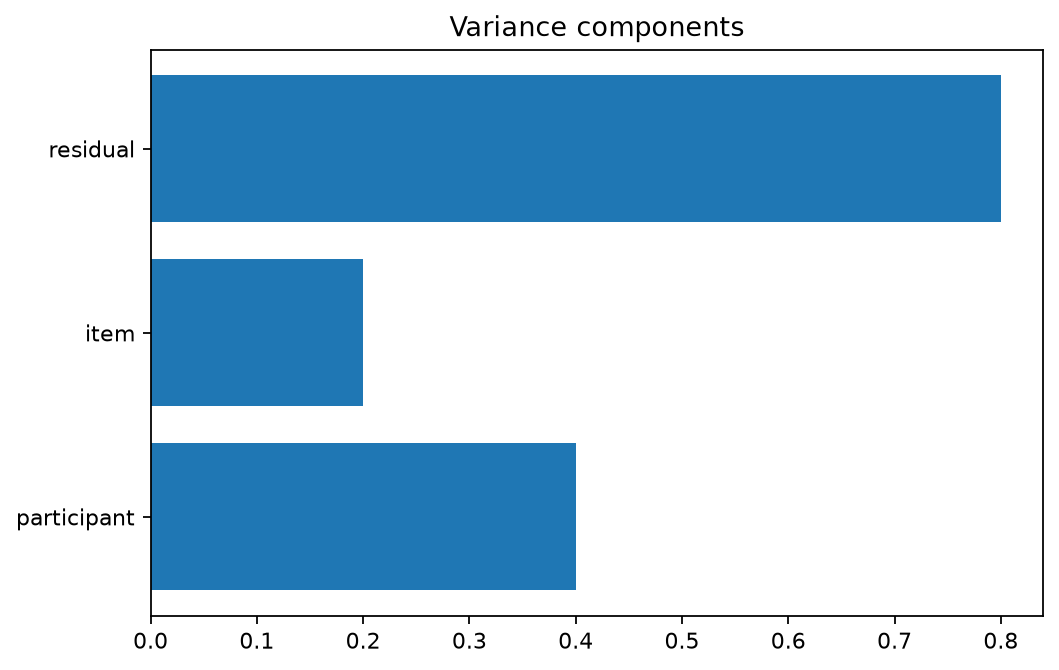
plot_variance_components()Interpretation boundary
Visual diagnostics remain descriptive evidence. They do not automatically certify adequacy, exclude observations, or select a model.