Mediation estimation gallery: what the figures establish
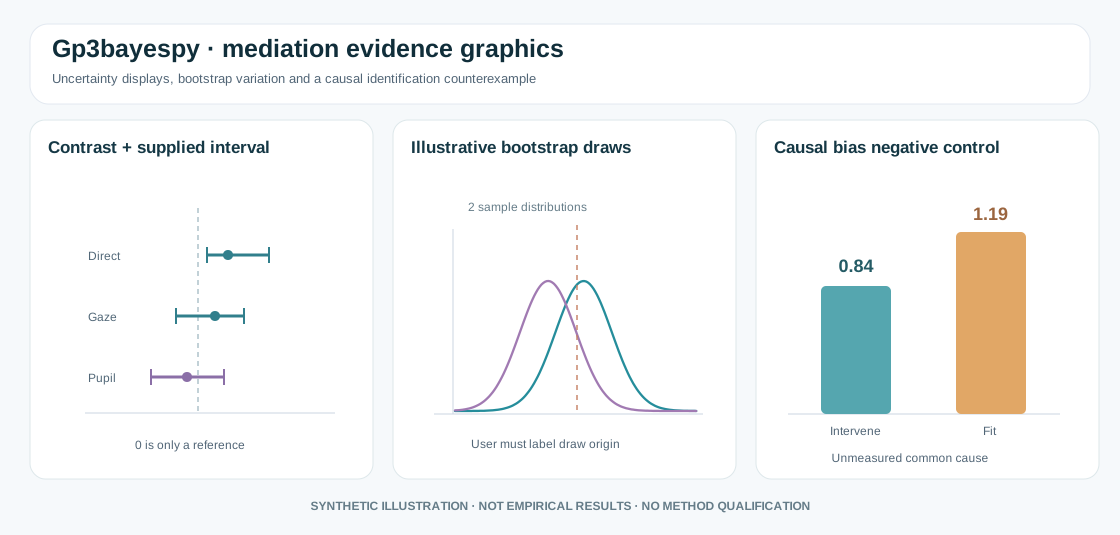
Original synthetic schematic. The effect intervals and density sketches are not computed from package posterior draws, nor do they represent empirical study results.
Forest plots need uncertainty provenance
An effect estimate with an interval is useful only when the reader knows which estimand, interval method, level of clustering and model generated it. A frequentist percentile-bootstrap interval is not automatically a Bayesian credible interval. Neither is an identified causal indirect effect merely because a numerical effect estimate appears in the same figure.
The experimental functional-form audit in PR #18 is frequentist, with participant-cluster refits, and is intentionally not an inference engine for Bayesian natural effects.
Visualise effect-size uncertainty, not only a significance flag
import numpy as np
import matplotlib.pyplot as plt

# Illustration only: supplied contrast and interval values, not model output.
labels = ["Direct association", "Gaze pathway", "Pupil pathway"]
estimate = np.array([.18, .12, -.03])
lower = np.array([.04, .02, -.12])
upper = np.array([.32, .23, .07])
xerr = np.vstack([estimate - lower, upper - estimate])
fig, ax = plt.subplots(figsize=(7, 3.5))
ax.errorbar(estimate, labels, xerr=xerr, fmt="o", capsize=3)
ax.axvline(0, color="grey", linestyle="--")
ax.set(xlabel="Illustrative effect with explicitly supplied interval",
       title="Interval visualisation does not identify its uncertainty type")
plt.show()
A DABEST-like raw-outcome visualization is best suited to a prespecified unadjusted participant-level contrast. If the inferential target is a random-effects GLMM contrast, mediation estimand or longitudinal trajectory, use posterior or bootstrap summaries computed from that same model rather than replacing them with independent-frame means. See the R gp3bayes figure gallery and the established DABEST project.
Why an exact nonlinear regression fit does not prove mediation causality
A known-truth benchmark contrasts two quantities under the constructed system:
- Mediator:
M = 0.4 + 0.7 X + U - Outcome:
Y = 1 + 0.2 X + 0.6 M + 0.4 M**2 + 0.5 U
The controlled mediator shift when the common cause U is fixed equals 0.84. A quadratic observational mediator-outcome model that omits U instead yields 1.19, a difference of 0.35. Correctly recovering the observed nonlinear regression does not recover the causal intervention in the presence of unmeasured mediator-outcome confounding.
import matplotlib.pyplot as plt

labels = ["Controlled intervention", "Model-based observational shift"]
values = [.84, 1.19]
fig, ax = plt.subplots(figsize=(7, 3.5))
bars = ax.bar(labels, values)
ax.bar_label(bars, fmt="%.2f")
ax.set(ylabel="Constructed mediator-shift contrast",
       title="Synthetic counterexample: observational contrast is not causal")
plt.show()
This is a deterministic negative control for overinterpretation, not empirical causal evidence. It cannot replace sequential exchangeability arguments, physical measurement validity or mediation sensitivity analysis.
Audit before publication
Report (a) causal diagram assumptions and equivalence-class uncertainty, (b) the actual effect estimand, (c) participant/trial hierarchy, (d) which distribution generated the draws, (e) nonlinear model sensitivity, (f) missingness and confounding assumptions, and (g) interval calibration.
Status: documentation-only educational illustration. The scientific qualification and release decisions for experimental APIs remain separate. No new PyPI version is implied.