Posterior Exploration and Publication Graphics
Python-facing port of
posterior-exploration-and-graphics.Rmdfrom the frozen R gp3bayes 0.5.0 reference. The statistical and governance framing below follows the canonical vignette; executable Python workflows use the mapped APIs listed later.
gp3bayespy separates numerical posterior summaries from graphics. The same
posterior draw matrix can therefore be inspected, tabulated, and plotted
without changing the fitted model or its contract.
Backend-independent posterior tables
Publication graphics
The plotting functions return ordinary plotting objects. They do not alter posterior draws, set decision thresholds, or turn interval exclusion into an automatic substantive conclusion.
Fitted-model extraction
For an approved fitted model, the post-fit API standardises extraction through
the posterior package:
Diagnostic flags request inspection. Their absence is not encoded as proof of model adequacy.
Python API mapping
gp3bayespy.extract_posterior_drawsgp3bayespy.mcmc_diagnostic_tablegp3bayespy.plot_autocorrelationgp3bayespy.plot_mcmc_qualitygp3bayespy.plot_posterior_areasgp3bayespy.plot_posterior_intervalsgp3bayespy.plot_rank_diagnosticsgp3bayespy.plot_sampler_diagnosticsgp3bayespy.posterior_correlation_tablegp3bayespy.posterior_interval_tablegp3bayespy.posterior_probability_tablegp3bayespy.sampler_diagnostic_tablegp3bayespy.summarise_mcmc_quality
Python usage
import gp3bayespy as gp

# All functions listed above are available from the package root.
# Use help(gp.<function>) or the API reference for the exact Python signature.
Visual companion
These figures complement the canonical ported narrative and are generated from package functions.
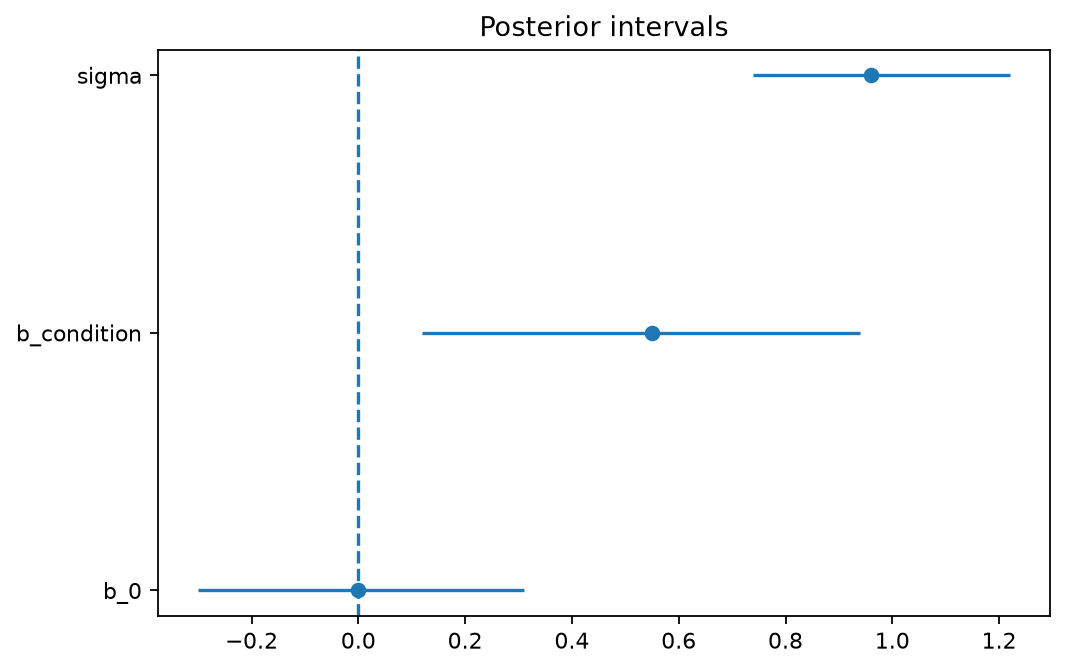
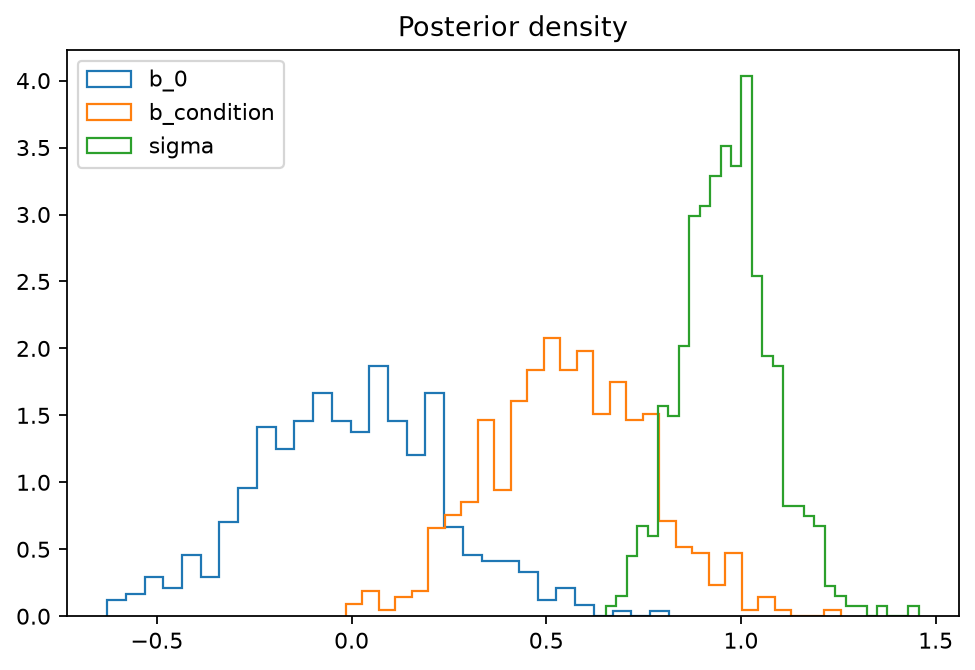
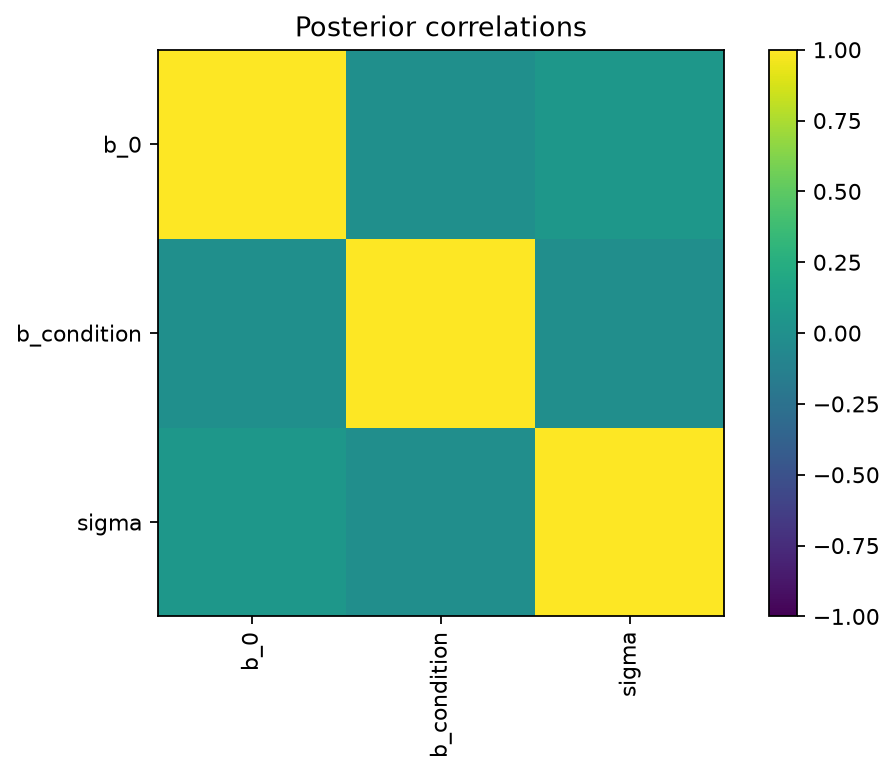
The figures remain descriptive evidence and do not create automatic inferential decisions.