Pointwise LOO Influence Atlases
Python-facing port of
loo-influence-atlas.Rmdfrom the frozen R gp3bayes 0.5.0 reference. The statistical and governance framing below follows the canonical vignette; executable Python workflows use the mapped APIs listed later.
Aggregate PSIS-LOO summaries can be read together with observation-level predictive contributions and influence diagnostics.
Flagged observations request inspection and are never removed automatically.
Python API mapping
gp3bayespy.create_loo_influence_atlasgp3bayespy.loo_flagged_datagp3bayespy.loo_influence_summarygp3bayespy.plot_loo_influence_rankgp3bayespy.plot_loo_pareto_vs_elpdgp3bayespy.plot_loo_pointwise_elpd
Python usage
import gp3bayespy as gp

# All functions listed above are available from the package root.
# Use help(gp.<function>) or the API reference for the exact Python signature.
An executable workflow for this family is included in ../../examples/loo_model_comparison.py.
Visual companion
These figures complement the canonical ported narrative and are generated from package functions.
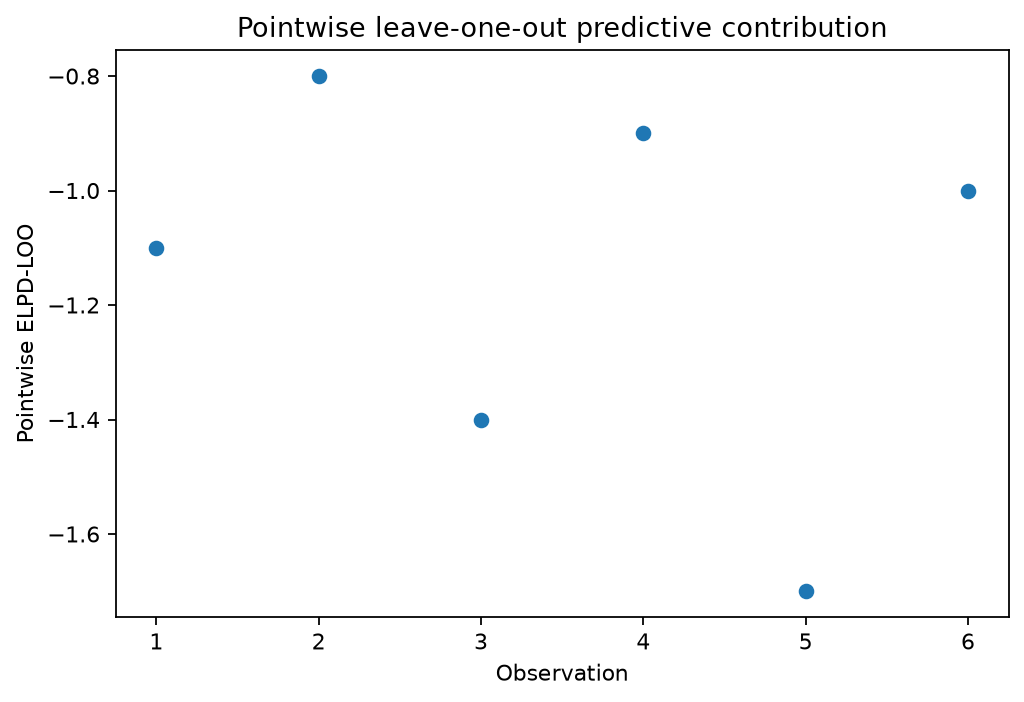
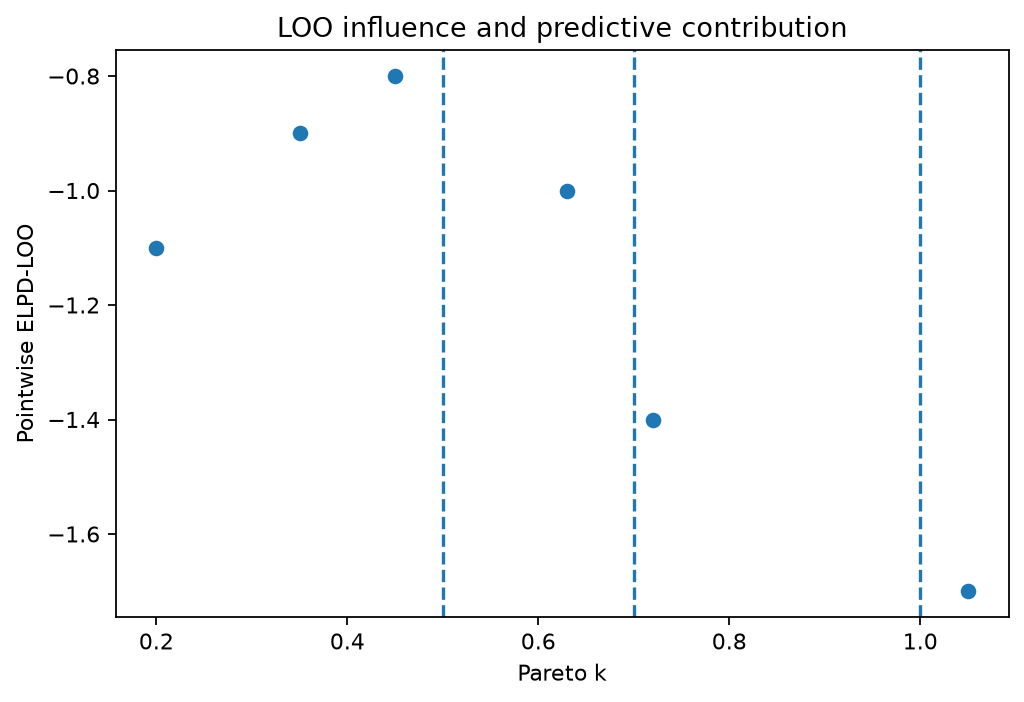
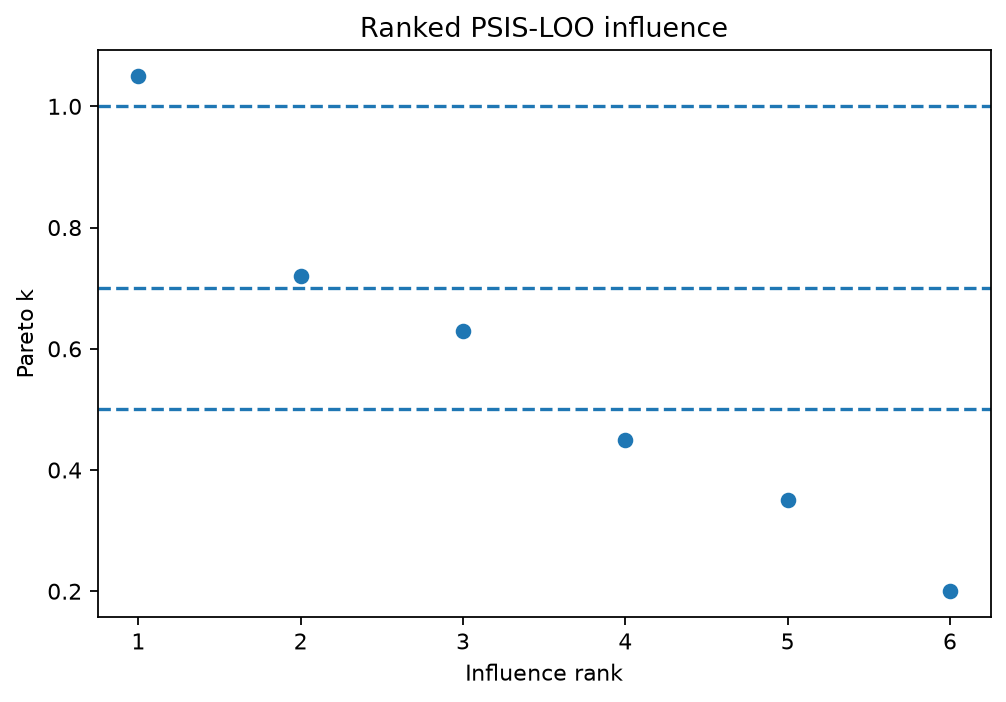
The figures remain descriptive evidence and do not create automatic inferential decisions.