Your first eyetrajectoriespy analysis
The most useful first analysis is one you can reproduce and interpret, not the most complicated model that happens to fit. This guide connects your data format to the right starting workflow and its reporting boundaries.
Explore visual methods Install the stable package Choose a Python data integration
1. Identify where your gaze came from
- I have a CSV or Parquet file
First verify participant/trial identifiers, coordinate meaning, timestamps, recorded gaps and unit semantics. Use the local, no-upload CSV inspector for small long-format extracts or the optional dataframe handoff.
- I have device exports or BIDS recordings
Start with the integration navigator. The pinned pymovements/SyeLink and read-only BIDS code is example-level, not released device validation. Preserve the originals and preprocessing record.
- I have repeated trials or missing x/y observations
Declare the participant as a potential independent unit and keep actual coordinate-specific support. Read the data-to-method guide before fitting.
2. Reproduce one complete example using invented data
The published 1.2.0 version provides three executable quickstarts. These use seeded synthetic demonstrations, not participant measurements:
| Your question | Runnable starter | What to inspect |
|---|---|---|
| What are the dominant x/y path modes? | Dense FPCA example | Time grid, scaling, coordinate interpretation |
| What if both coordinates were observed sparsely? | Paired sparse example | Actual retained timestamps, covariance and smoothing |
| Does a declared condition vary over time? | Functional regression example | Independent unit, fixed design, estimation target |
Alternatively download the tiny invented CSV and runnable script, then inspect the schematic path using the synthetic trajectory explorer.
3. Explore the figure before interpreting a statistic
- FPCA interpretation
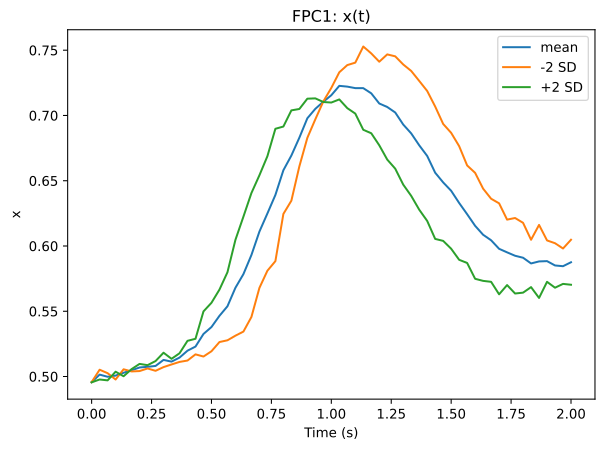
Interpret component shapes as modes of variability, not evidence for an unmeasured psychological factor.
FPCA guidance · Visual explorer
- Sparse-support assumptions
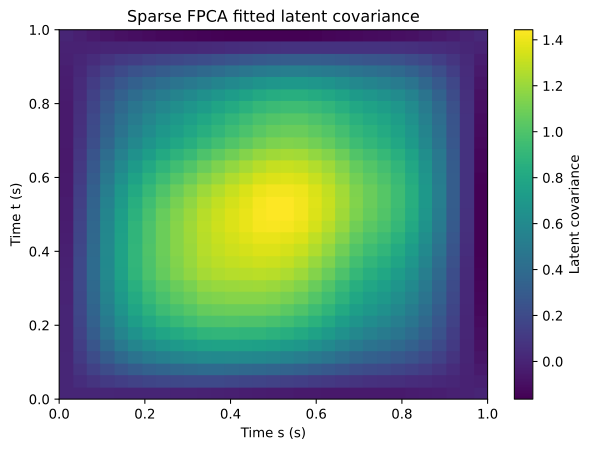
Retain sparse observations rather than constructing an unexplained common grid.
Sparse FPCA · Data preparation
- Regression and uncertainty
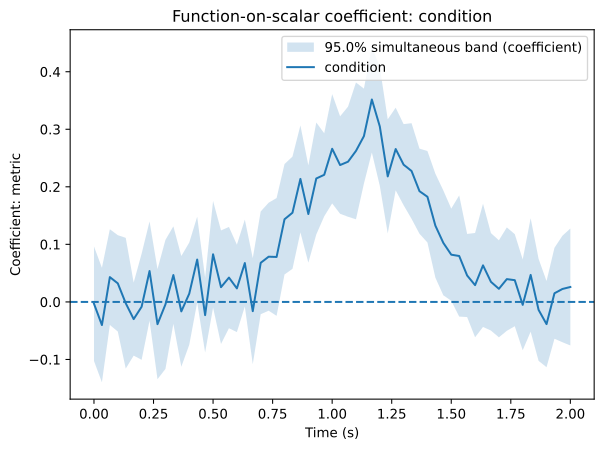
Report the target, independent sampling unit and method-specific calibration requirements.
4. Select the next research-level step
Match your actual question using the interactive method selector and the ten-workflow comparison. The ten module-scoped W1–W4 workflows are in published stable 1.2.0; E1–E4 research helpers are experimental.
Do not treat an attractive figure as validation
A successful fit or illustrative band does not justify whole-function coverage, identify the missing gaze mechanism, or establish device accuracy. Consult the scientific limitations and the unresolved whole-function inference #289 and missing-gaze #296 before reporting empirical uncertainty.
5. Save a reproducible research trail
Preserve the package version, recorded data provenance, time and coordinate units, participant/trial grouping, exclusions, declared analysis and model settings, diagnostic plots and the workflow output bundle.