Plot gallery
Visual diagnostics
Inspect governed objects without changing them
gp3mlpy plot methods visualize audit, validation, robustness, threshold, shift, reproducibility, and portability objects. The documentation build regenerates every featured figure from the current Python package.
The gallery uses deliberately small synthetic documentation fixtures. These figures demonstrate rendering contracts only; they are not scientific results and should not be interpreted substantively.
Featured diagnostics
Decision-threshold evaluation
Decision governance
Explicit candidate thresholds
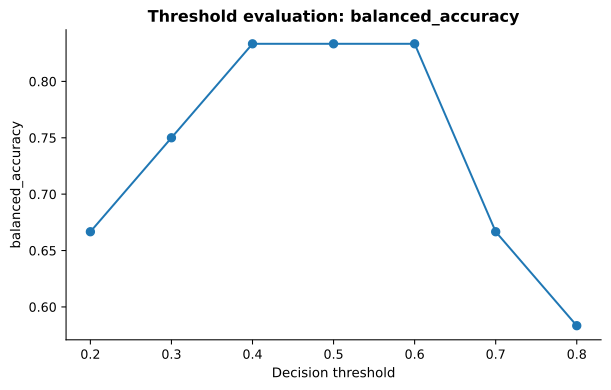
Candidate thresholds are declared by the analyst. The plot visualizes the resulting metric surface rather than choosing a hidden optimum.
Related API: evaluate_gazepoint_thresholds, select_gazepoint_threshold, create_gazepoint_decision_rule.
Show Python example
import numpy as np
import gp3mlpy as gp

thresholds = gp.evaluate_gazepoint_thresholds(
    truth=["control", "control", "target", "target"],
    probability=[0.15, 0.42, 0.63, 0.88],
    positive="target",
    thresholds=np.linspace(0.2, 0.8, 7),
)

fig = thresholds.plot(metric="balanced_accuracy")
Predictor-distribution shift
External validation
Keep shift distinct from outcome performance
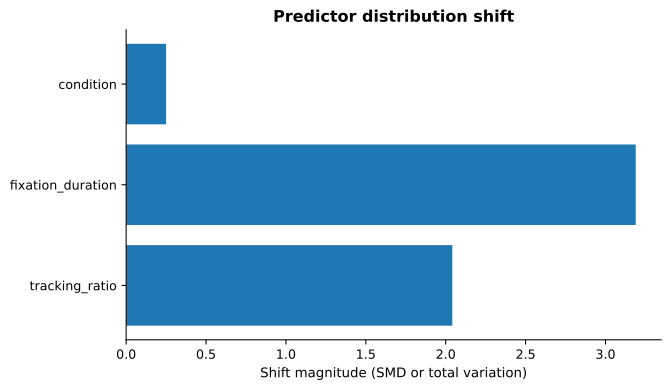
Numeric predictors are summarized with standardized differences; categorical predictors use a distribution statistic. Shift is reported separately from outcome prevalence, calibration, and predictive performance.
Related API: audit_gazepoint_dataset_shift, audit_gazepoint_missingness_shift, summarize_gazepoint_shift.
Show Python example
shift = gp.audit_gazepoint_dataset_shift(
    development,
    external,
    predictors=["tracking_ratio", "fixation_duration", "condition"],
)

fig = shift.plot()
Engine portability
Runtime capability
Make backend assumptions visible
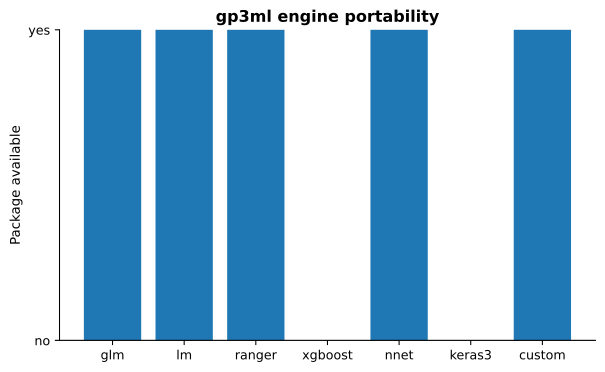
Core engines and optional backends are displayed explicitly so portability assumptions are not buried inside model fitting or silently changed across environments.
Related API: gp3ml_engine_capabilities, gp3ml_available_engines, assert_gp3ml_engine_available.
Show Python example
import gp3mlpy as gp
from gp3mlpy.plotting import plot_engine_capabilities

capabilities = gp.gp3ml_engine_capabilities()
fig = plot_engine_capabilities(capabilities)
Governance evidence
Evidence review
Show what is evidenced and what still needs review
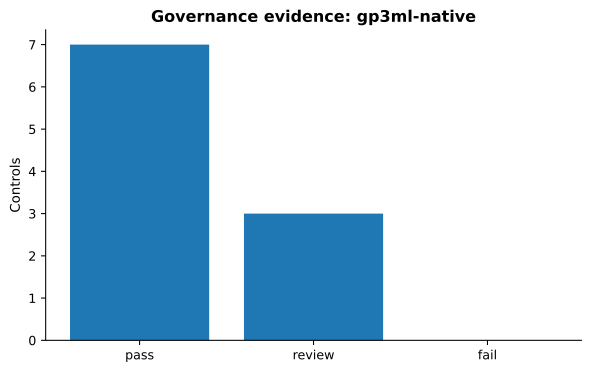
Controls with available evidence and controls requiring review are surfaced directly rather than collapsed into one opaque score.
Related API: create_gp3ml_governance_profile, audit_gp3ml_governance_profile.
Show Python example
profile = gp.create_gp3ml_governance_profile(evidence)
audit = gp.audit_gp3ml_governance_profile(profile)
fig = audit.plot()
The complete plotting surface
Decision + uncertainty
Threshold evaluation · abstention · conformal coverage
Validation + robustness
Dataset shift · model robustness · environment comparison
Governance + planning
Governance profile · analysis-plan deviations · API stability
Artifacts + reproducibility
Handoffs · model artifacts · research bundles · RO-Crate · checksums · reproducibility
Plot methods are intentionally thin: they visualize the state of an existing governed object. They do not mutate the analysis, refit models, select models, or change validation decisions.
Need the function behind a plot? Use the workflow API map for stage-oriented discovery or the complete API reference for exact-name lookup.