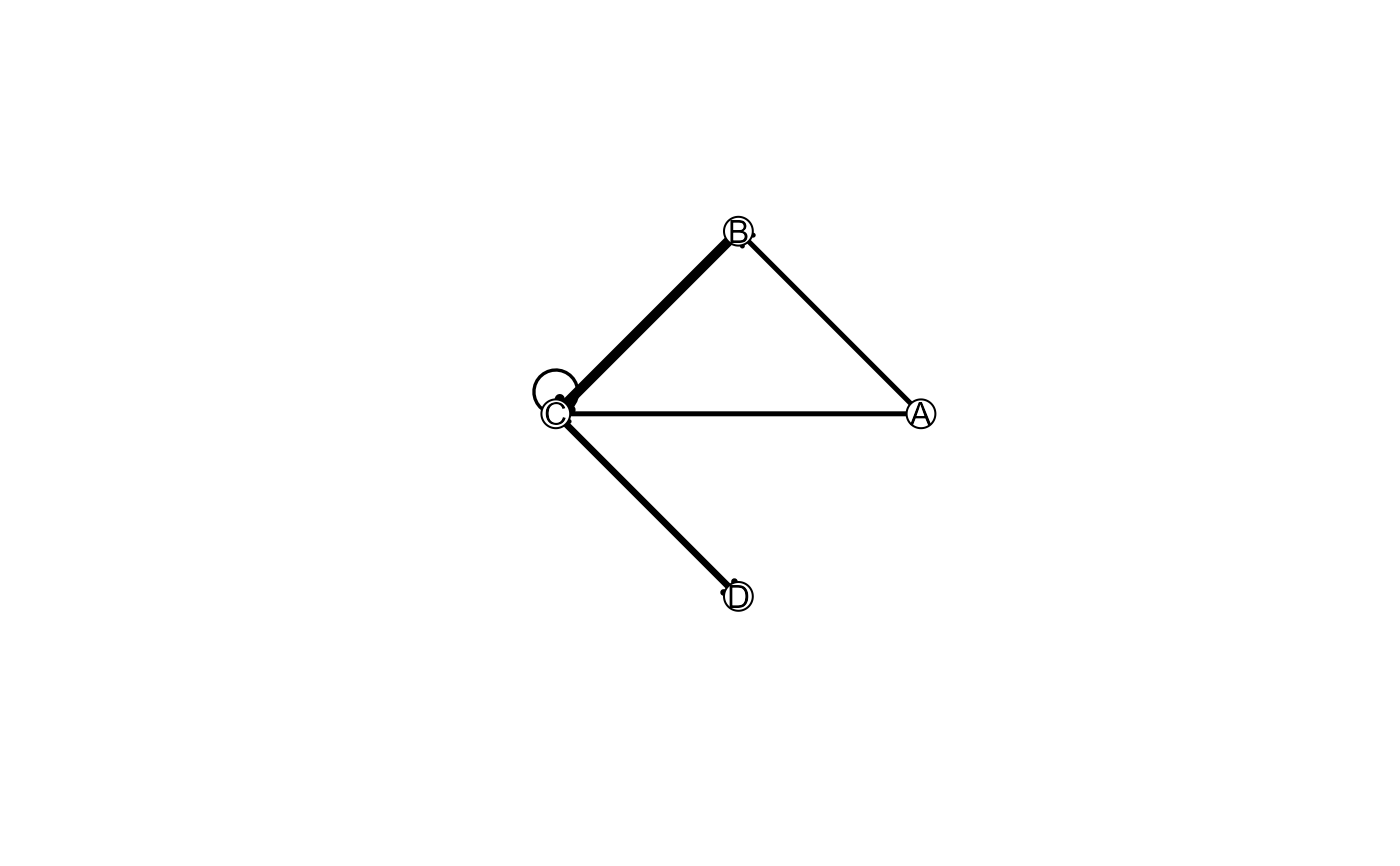
Plot a first-order transition network
Source:R/sequence-visualisations-extended.R
plot_transition_network.RdPlot a first-order transition network
Usage
plot_transition_network(
  network,
  weight_col = "weight",
  minimum_weight = 0,
  vertex_cex = 1,
  edge_scale = 5,
  ...
)
Arguments
- network
A first-order network from
create_transition_network().- weight_col
Edge-weight column.
- minimum_weight
Minimum plotted edge weight.
- vertex_cex
Vertex label size.
- edge_scale
Edge-width multiplier.
- ...
Additional arguments passed to
graphics::plot.window().
Examples
data <- data.frame(sequence_id = rep(c("a", "b"), each = 4L),
                   sequence_order = rep(1:4, 2L),
                   state = c("A", "B", "C", "D", "A", "C", "C", "D"))
plot_transition_network(create_transition_network(data, normalise = "from"))