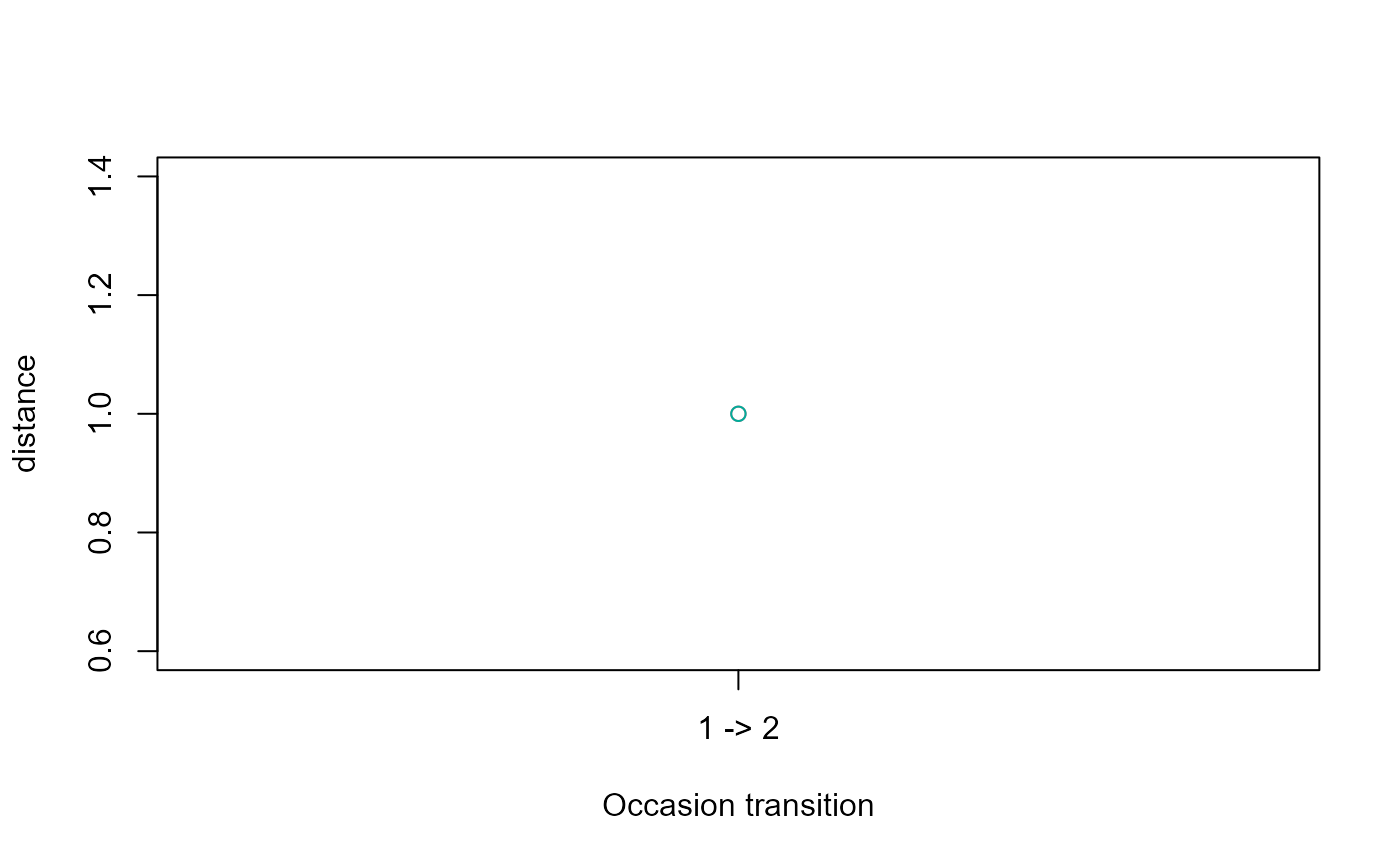
Plot longitudinal sequence changes
Arguments
- changes
A result from
compare_sequence_panel_changes().- metric
One of
"distance","length_change", or"transition_change".- type
Plot individual panel trajectories or occasion-transition means.
- ...
Additional graphical arguments passed to base plotting functions.
Examples
panel_data <- data.frame(
  participant_id = rep(c("p1", "p2"), each = 6L),
  occasion = rep(rep(c(1, 2), each = 3L), times = 2L),
  sequence_id = rep(c("a", "b", "c", "d"), each = 3L),
  sequence_order = rep(1:3, times = 4L),
  state = c("A", "B", "C", "A", "C", "C", "C", "B", "A", "C", "B", "B")
)
changes <- compare_sequence_panel_changes(
  prepare_sequence_panel(panel_data, "participant_id", "occasion")
)
plot_sequence_panel_changes(changes)