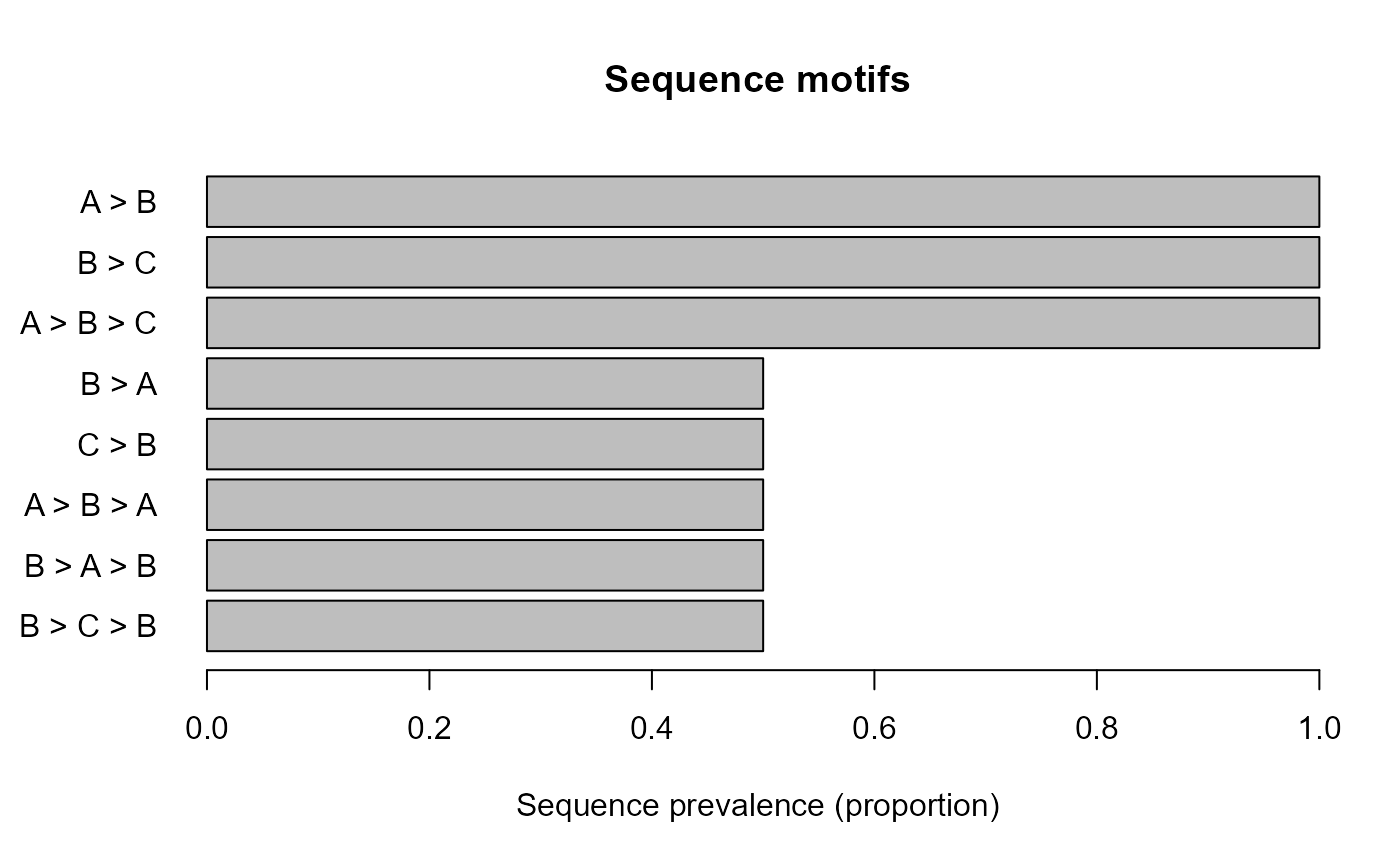
Draws a dependency-free base-R bar chart of structural motif measurements.
Arguments
- x
A motif extraction, summary, or filtered-motif object.
- metric
Structural metric to plot:
"sequence_prevalence","n_occurrences","n_sequences", or"occurrence_share".- top_n
Positive whole number giving the requested number of motifs.
- motif_lengths
Optional vector of positive whole-number motif lengths to retain.
- ties
Top-
nboundary policy."include"retains all motifs tied on the selected metric;"first"retains exactlytop_nafter deterministic secondary sorting.- horizontal
Logical value indicating whether bars should be horizontal.
Value
Invisibly returns the exact motif table used for plotting, including
plot_rank, plot_value, plot_label, and bar_midpoint.
Details
The plot is descriptive. It does not perform inferential testing or assign substantive meaning to motif frequency or prevalence. Empty inputs produce an informative blank plot and return an empty table.
Examples
sequences <- data.frame(
  id = c(rep("s1", 5L), rep("s2", 4L)),
  position = c(1:5, 1:4),
  state = c("A", "B", "A", "B", "C", "A", "B", "C", "B")
)

extracted <- extract_sequence_ngrams(
  sequences,
  sequence_id_col = "id",
  order_col = "position",
  state_col = "state"
)

plot_sequence_motifs(
  extracted,
  metric = "sequence_prevalence",
  top_n = 10
)