Plot Sequence Motif Positions
Source:R/sequence-motif-visualisation.R
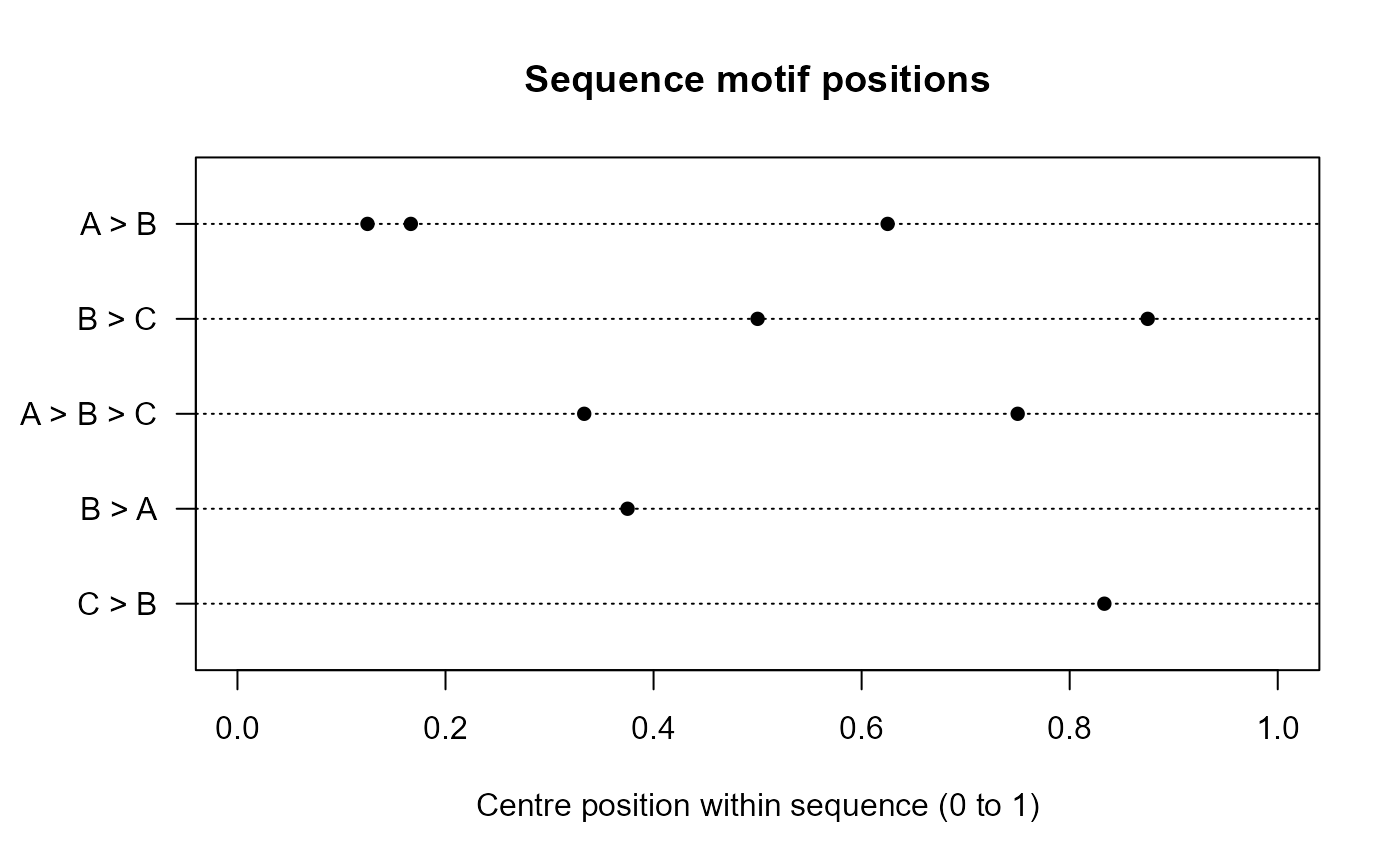
plot_sequence_motif_positions.RdShows occurrence locations for selected contiguous motifs.
Arguments
- x
An object returned by
extract_sequence_ngrams()orsummarise_sequence_motif_positions().- motifs
Optional character vector of motif identifiers, motif keys, or displayed motif labels. When omitted, motifs are selected deterministically by occurrence count, sequence count, motif length, and motif key.
- position
Occurrence position represented by motif
"start","centre", or"end".- scale
Position scale: one-based
"absolute"sequence positions or"relative"positions from 0 to 1.- top_n
Positive whole number giving the number of motifs selected when
motifsisNULL.- display
Base-R display type: occurrence
"strip"or"distribution"boxplots.
Value
Invisibly returns the exact occurrence-level data used by the plot, including deterministic motif ranks and plotting coordinates where relevant.
Details
The strip display uses deterministic vertical stacking rather than random jitter. The distribution display uses one horizontal boxplot per motif. Empty inputs produce an informative blank plot and return an empty table. The function provides structural location summaries only.
Examples
sequences <- data.frame(
  id = c(rep("s1", 5L), rep("s2", 4L)),
  position = c(1:5, 1:4),
  state = c("A", "B", "A", "B", "C", "A", "B", "C", "B")
)

extracted <- extract_sequence_ngrams(
  sequences,
  sequence_id_col = "id",
  order_col = "position",
  state_col = "state"
)

plot_sequence_motif_positions(
  extracted,
  position = "centre",
  scale = "relative",
  top_n = 5,
  display = "strip"
)