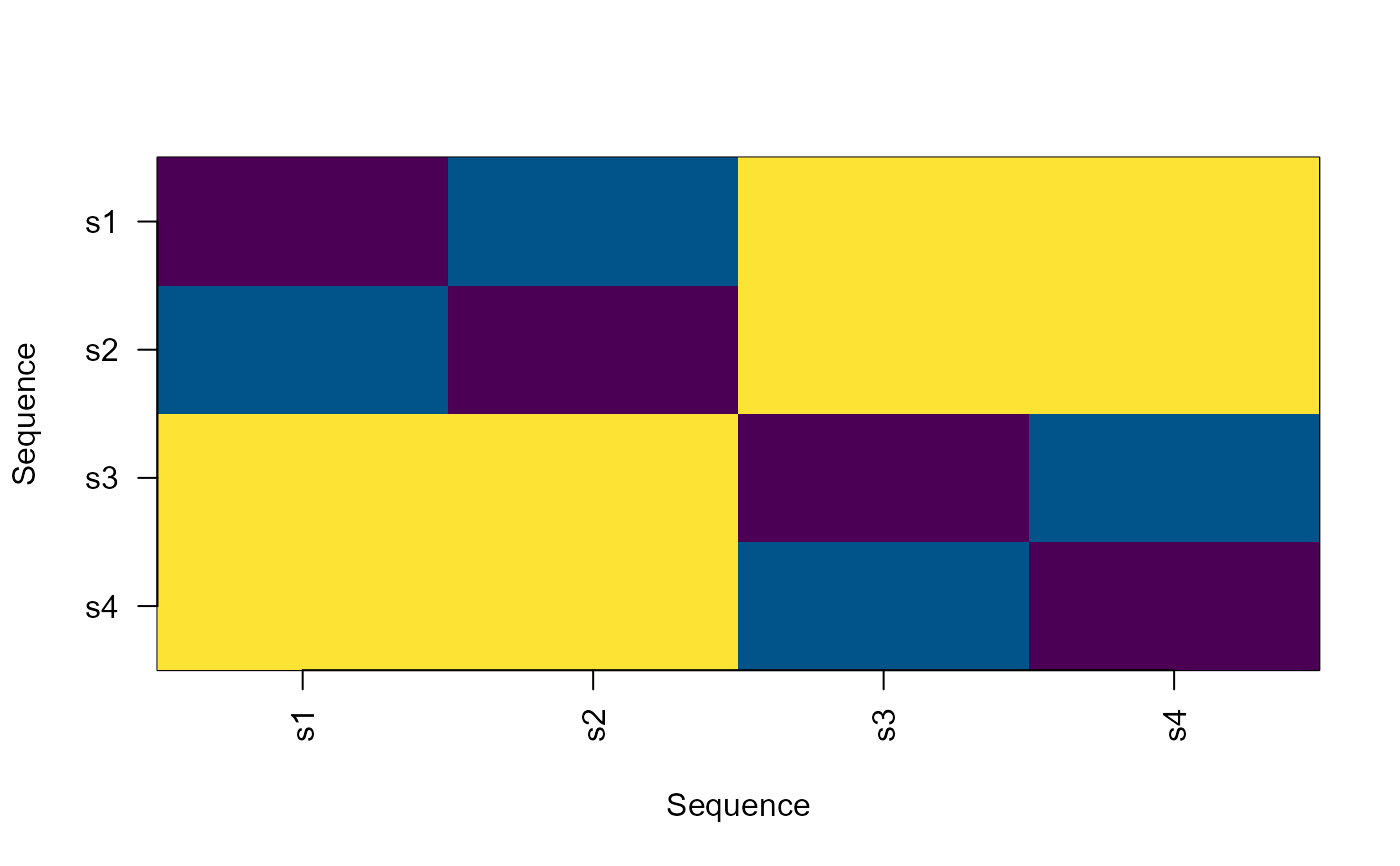
Plot a sequence-distance heatmap
Source:R/sequence-visualisations-extended.R
plot_sequence_distance_heatmap.RdPlot a sequence-distance heatmap
Usage
plot_sequence_distance_heatmap(
  distance,
  order_by = NULL,
  palette = "Viridis",
  show_labels = TRUE,
  ...
)
Arguments
- distance
A sequence distance object or square matrix.
- order_by
Optional clustering or named assignment vector used to order the matrix.
- palette
Base HCL palette.
- show_labels
Draw sequence identifiers.
- ...
Additional arguments passed to
graphics::image().
Examples
data <- data.frame(sequence_id = rep(paste0("s", 1:4), each = 4L),
                   sequence_order = rep(1:4, 4L),
                   state = c("A", "B", "C", "D", "A", "B", "C", "C",
                             "D", "C", "B", "A", "D", "C", "A", "A"))
plot_sequence_distance_heatmap(compute_sequence_distance(data))